

ValuEngine tracks more than 7000 US equities, ADRs, and foreign stock which trade on US exchanges as well as @1000 Canadian equities. When EPS estimates are available for a given equity, our model calculates a level of mispricing or valuation percentage for that equity based on earnings estimates and what the stock should be worth if the market were totally rational and efficient--an academic exercise to be sure, but one which allows for useful comparisons between equities, sectors, and industries. Using our Valuation Model, we can currently assign a VE valuation calculation to more than 2800 stocks in our US Universe.
We combine all of the equities with a valuation calculation to track market valuation figures and use them as a metric for making calls about the overall state of the market. Two factors can lower these figures-- a market pullback, or a significant rise in EPS estimates.
We also use trading data to provide forecast estimates for a variety of time horizons for almost ever equity in our database. Our Buy/Sell/Hold recommendations are based upon the 1-year forecast return figure. Using valuation and forecast figures, you can rank and rate our covered stocks against each other, to find out, in an objective and systematic way, the most attractive investment targets based on your own risk/reward parameters. We re-calculate the entire database every trading day, so you are assured that every proprietary valuation and forecast datapoint is as up-to-date as possible.
For today's edition of our upgrade list, we used our website's advanced screening functions to search for UPGRADES to BUY or STRONG BUY with complete forecast and valuation data. Career Education Corporation (CECO) is our top-rated upgrade this week and it is a STRONG BUY.
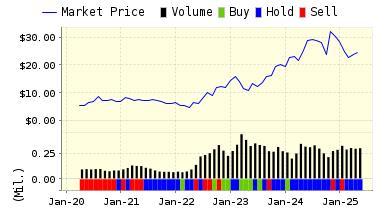
Below is today's data on Career Education Corporation (CECO):
Career Education Corporation is a provider of private, for-profit post-secondary education with campuses throughout the United States and Canada, the United Kingdom and the United Arab Emirates. Their schools enjoy long operating histories and offer a variety of master's degree, bachelor's degree, associate degree, and diploma programs in career-oriented disciplines. They offer educational programs principally in the following four career-related fields of study, Visual Communication and Design Technologies, Information Technology, Business Studies, and Culinary Arts.
VALUENGINE RECOMMENDATION: ValuEngine updated its recommendation from BUY to STRONG BUY for CAREER EDU CORP on 2016-12-30. Based on the information we have gathered and our resulting research, we feel that CAREER EDU CORP has the probability to OUTPERFORM average market performance for the next year. The company exhibits ATTRACTIVE Momentum and P/E Ratio.
|
ValuEngine Forecast |
||
|
Target |
Expected |
|
|---|---|---|
|
1-Month |
10.22 | 1.27% |
|
3-Month |
10.59 | 4.93% |
|
6-Month |
11.05 | 9.55% |
|
1-Year |
11.64 | 15.31% |
|
2-Year |
13.11 | 29.91% |
|
3-Year |
14.58 | 44.46% |
|
Valuation & Rankings |
|||
|
Valuation |
72.52% overvalued |
Valuation Rank(?) |
 4 4 |
|
1-M Forecast Return |
1.27% |
1-M Forecast Return Rank |
100 |
|
12-M Return |
169.79% |
Momentum Rank(?) |
97 |
|
Sharpe Ratio |
0.10 |
Sharpe Ratio Rank(?) |
59 |
|
5-Y Avg Annual Return |
6.94% |
5-Y Avg Annual Rtn Rank |
67 |
|
Volatility |
69.58% |
Volatility Rank(?) |
24 |
|
Expected EPS Growth |
-79.15% |
EPS Growth Rank(?) |
4 |
|
Market Cap (billions) |
0.68 |
Size Rank |
58 |
|
Trailing P/E Ratio |
11.69 |
Trailing P/E Rank(?) |
88 |
|
Forward P/E Ratio |
56.06 |
Forward P/E Ratio Rank |
6 |
|
PEG Ratio |
n/a |
PEG Ratio Rank |
n/a |
|
Price/Sales |
0.77 |
Price/Sales Rank(?) |
75 |
|
Market/Book |
2.62 |
Market/Book Rank(?) |
43 |
|
Beta |
2.12 |
Beta Rank |
10 |
|
Alpha |
0.74 |
Alpha Rank |
96 |
ValuEngine Market Overview
|
Summary of VE Stock Universe |
|
|
Stocks Undervalued |
34.55% |
|
Stocks Overvalued |
65.45% |
|
Stocks Undervalued by 20% |
15.36% |
|
Stocks Overvalued by 20% |
32.41% |
ValuEngine Sector Overview
|
Sector |
Change |
MTD |
YTD |
Valuation |
Last 12-MReturn |
P/E Ratio |
|
0.00% |
0.00% |
0.00% |
19.24% overvalued |
24.80% |
26.14 |
|
|
0.00% |
0.00% |
0.00% |
17.48% overvalued |
14.63% |
19.81 |
|
|
0.00% |
0.00% |
0.00% |
17.31% overvalued |
22.80% |
24.43 |
|
|
0.00% |
0.00% |
0.00% |
16.16% overvalued |
15.08% |
18.15 |
|
|
0.00% |
0.00% |
0.00% |
13.89% overvalued |
11.31% |
20.25 |
|
|
0.00% |
0.00% |
0.00% |
11.15% overvalued |
9.16% |
24.67 |
|
|
0.00% |
0.00% |
0.00% |
10.83% overvalued |
18.75% |
21.69 |
|
|
0.00% |
0.00% |
0.00% |
10.55% overvalued |
22.60% |
21.27 |
|
|
0.00% |
0.01% |
-0.01% |
9.31% overvalued |
65.68% |
26.50 |
|
|
0.00% |
0.00% |
0.00% |
9.23% overvalued |
8.15% |
18.04 |
|
|
-0.01% |
-0.00% |
0.58% |
7.62% overvalued |
12.89% |
30.71 |
|
|
0.00% |
0.00% |
0.00% |
6.64% overvalued |
21.92% |
14.86 |
|
|
0.00% |
0.00% |
0.00% |
5.90% overvalued |
10.31% |
24.73 |
|
|
0.00% |
0.00% |
0.00% |
4.26% overvalued |
19.26% |
24.14 |
|
|
0.00% |
0.00% |
0.00% |
3.91% overvalued |
7.10% |
22.96 |
|
|
0.00% |
0.00% |
0.00% |
8.20% undervalued |
-10.10% |
28.21 |
Comments
Log in or sign up to join the conversation.