
We now calculate that 36.86% of the stocks we can assign a valuation are overvalued and 11.05% of those stocks are overvalued by 20% or more. These numbers have recovered a bit along with the market rally since the earlier "unpleasantness" of 2016. We are now showing stocks that have recovered in value, are less cheap than last month, and also hovering very close to "normal" range--between 40-60%.
2016 has been a challenge for investors. markets have recovered somewhat over the past month, but are still down between 2-8% (SP500, Dow, and Nasdaq). We have been in a seven-year up market--almost the entirety of the Obama administration--and thus we have a rally that is long-in-the-tooth despite a continuing drumbeat of decent news from the US economy--labor market, housing, autos, etc.
The challenge has come from elsewhere as the Chinese stock carnage and devaluation, along with ongoing problems in Europe, chaos for commodities--especially oil--etc. have battered markets recently. Because of these external factors, we still believe that the Fed move to raise interest rates was premature at best. US growth rates are anemic and the labor market still hasn't provided the sort of wage gains that are to be expected with a full--and fair--recovery. We hope that the Fed might pay attention to more of its two-part mandate by letting unemployment slip enough to boost wages for US workers. We think this would help to further bolster the economy despite the global uncertainties.
In case you hadn't noticed, the US is in a presidential election cycle, which is in the past has correlated to a decent year for stocks. We find that any demands for additional austerity on the part of some right-wing candidates would only damage the US recovery. From the left, we note that one candidate is widely supported by Wall St.-- which is hardly a harbinger of damaging policies for investors. On the other hand, the long-shot Democrat promises a radically different approach, which will certainly take a bite out of the financial sector--if implemented.
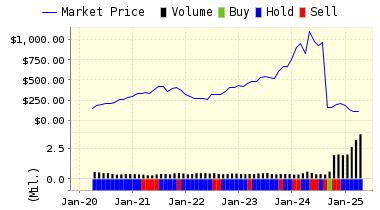
In any case, we remain stunned at just how wrong the pundits had it during the last administrative change, when screams of "socialism" and warnings of total economic collapse were the norm. As the long-term valuation chart below illustrates, we have witnessed a remarkable market since the devilish SP500 intra day low of 666 on March 9, 2009.
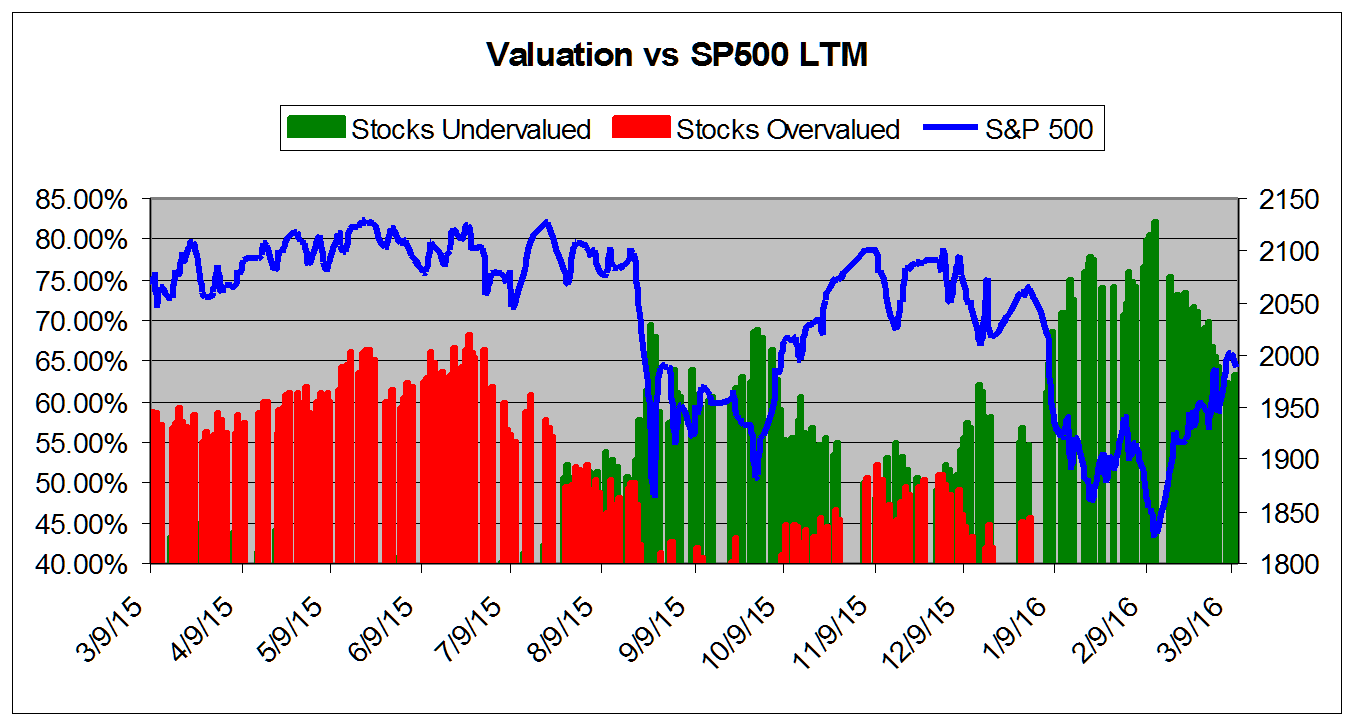
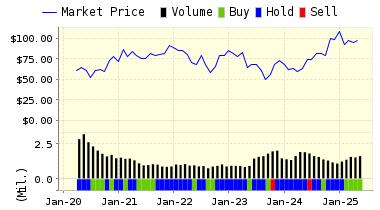
The chart below tracks the valuation metrics from February 2015. It shows levels in excess of 40%.
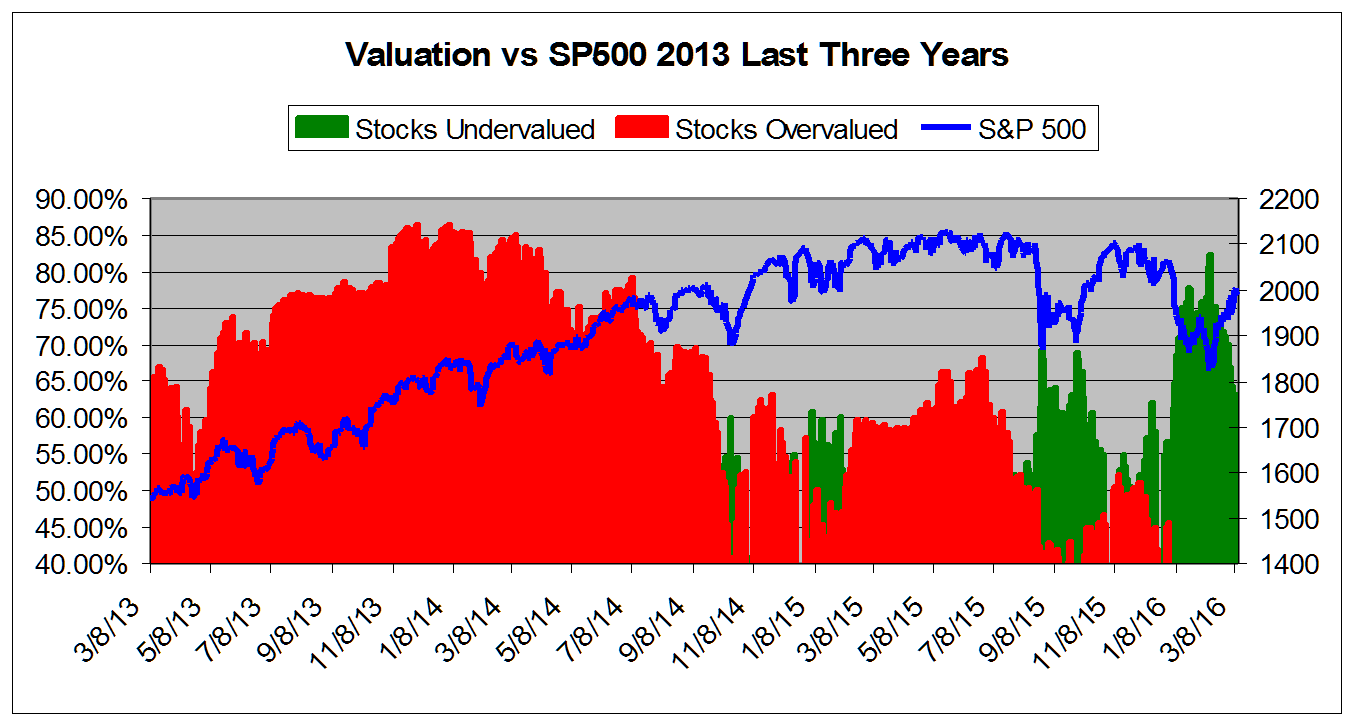
This chart shows overall universe over valuation in excess of 40% vs the S&P 500 from February 2013
This chart shows overall universe under and over valuation in excess of 40% vs the S&P 500 from March 2007*
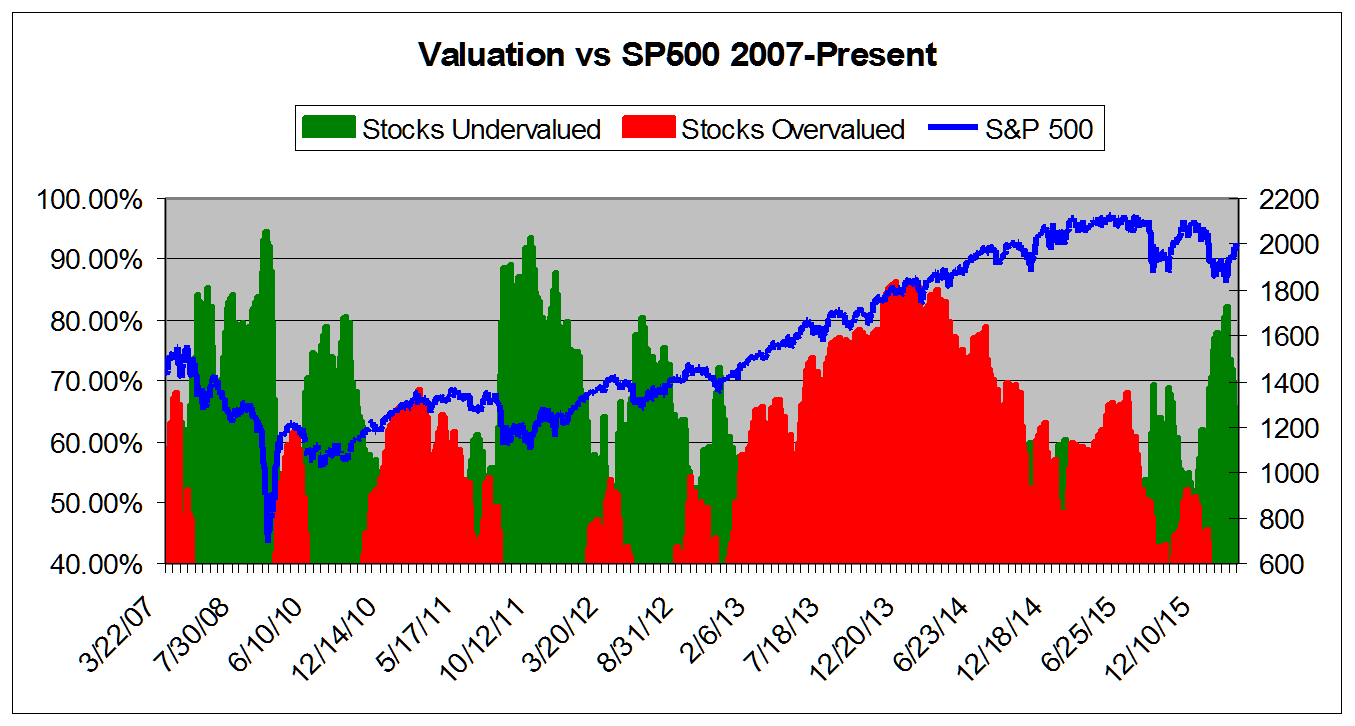
*NOTE: Time Scale Compressed Prior to 2011.
Market Overview
|
Summary of VE Stock Universe |
|
|
Stocks Undervalued |
63.14% |
|
Stocks Overvalued |
36.86% |
|
Stocks Undervalued by 20% |
28.42% |
|
Stocks Overvalued by 20% |
11.05% |
Sector Overview
|
Sector |
Change |
MTD |
YTD |
Valuation |
Last 12-MReturn |
P/E Ratio |
|
Utilities |
-0.45% |
2.74% |
3.47% |
7.90% overvalued |
-1.69% |
23.23 |
|
Consumer Staples |
0.90% |
3.42% |
1.83% |
6.27% overvalued |
-0.09% |
24.77 |
|
Basic Materials |
0.25% |
8.34% |
11.31% |
1.82% overvalued |
-7.47% |
26.02 |
|
Multi-Sector Conglomerates |
0.16% |
6.69% |
0.57% |
0.77% overvalued |
-15.93% |
19.19 |
|
Industrial Products |
0.50% |
5.57% |
0.60% |
1.94% undervalued |
-14.81% |
17.70 |
|
Computer and Technology |
0.45% |
2.89% |
0.99% |
4.19% undervalued |
-10.00% |
26.12 |
|
Aerospace |
1.21% |
3.14% |
-4.40% |
5.10% undervalued |
-12.23% |
18.63 |
|
Business Services |
0.39% |
3.52% |
-2.12% |
5.14% undervalued |
-12.26% |
21.42 |
|
Consumer Discretionary |
0.41% |
3.48% |
-0.71% |
6.67% undervalued |
-8.90% |
24.09 |
|
Finance |
0.28% |
3.51% |
-4.05% |
6.95% undervalued |
-7.98% |
15.31 |
|
Retail-Wholesale |
0.37% |
3.48% |
-0.33% |
7.57% undervalued |
-12.71% |
22.31 |
|
Oils-Energy |
0.71% |
13.20% |
2.90% |
8.62% undervalued |
-36.69% |
22.15 |
|
Construction |
0.37% |
4.79% |
-0.68% |
11.11% undervalued |
-7.46% |
18.72 |
|
Auto-Tires-Trucks |
0.65% |
9.03% |
-2.32% |
11.40% undervalued |
-20.70% |
12.14 |
|
Transportation |
0.84% |
4.64% |
-1.54% |
13.50% undervalued |
-24.46% |
12.62 |
|
Medical |
0.13% |
3.47% |
-11.04% |
14.81% undervalued |
-24.45% |
25.87 |
Valuation Watch: Overvalued stocks now make up 36.86% of our stocks assigned a valuation and 11.05% of those equities are calculated to be overvalued by 20% or more. Four sectors are calculated to be overvalued.
Comments
Log in or sign up to join the conversation.