


I have been hearing a lot lately about the extended valuation of the equity market as it relates to the Shiller P/E, also known as the Cyclically Adjusted Price to Earnings ratio or CAPE ratio. The Shiller P/E was developed by Robert Shiller, a Yale university professor. To calculate the Shiller P/E, one uses the 10-year average of inflation adjusted earnings in the denominator. The common standard P/E simply uses the 12-months earnings for the S&P 500 Index. As the red line in the below chart shows, the current Shiller P/E of 41.1 times is currently near a high last reached preceding the bursting of the technology bubble in 2000. The blue line on the chart is what one calls the NIPA P/E.
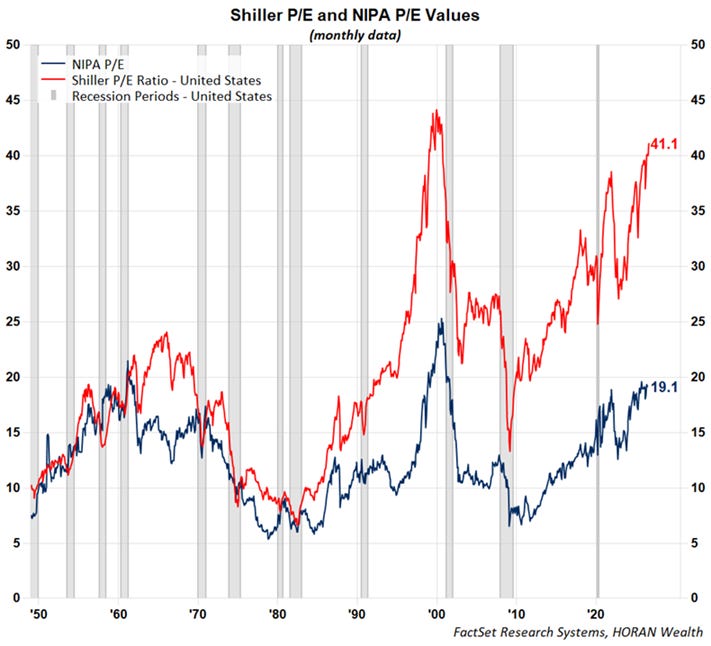
The “E” in the NIPA ratio represents corporate profits from the National Income and Product Accounts, hence NIPA. The NIPA profit figure is used in the Bureau of Economic Analysis’ calculation of GDP. The benefit of using the NIPA corporate profit figure is,
"it represents profits from current production that provides a comprehensive and consistent economic measure of the income earned by all U.S. corporations. As such, it is unaffected by changes in tax laws, and it is adjusted for nonreported and misreported income. It excludes dividend income, capital gains and losses, and other financing flows and adjustments, such as deduction for “bad debt.” Thus, the NIPA measure of profits is a particularly useful analytical measure of the health of the corporate sector. For example, in contrast to other popular measures of corporate profits, the NIPA measure did not show the large run-up in profits during the late 1990's that was primarily attributable to capital gains."
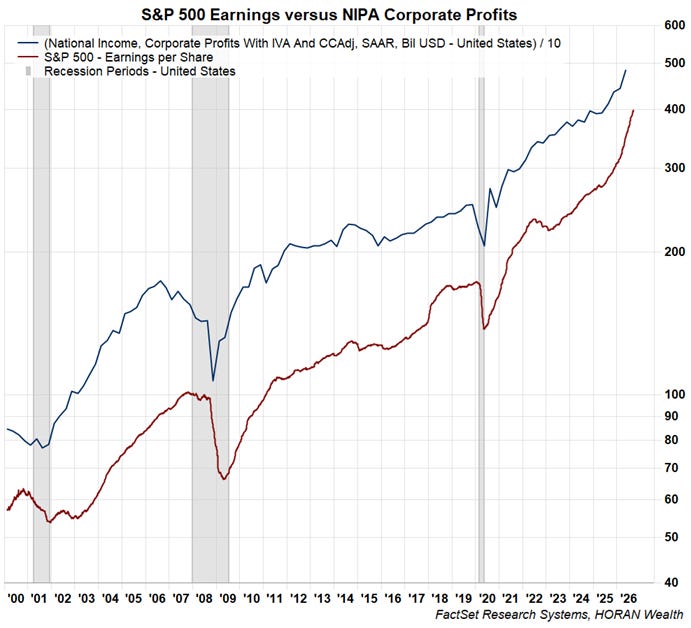
One aspect of the NIPA corporate profits number is the fact it has a tendency to peak about five months before the S&P 500 earnings per share that is used in the standard calculation of the P/E ratio as seen in the below chart. A longer version of the below chart can be seen in a post written in 2017.
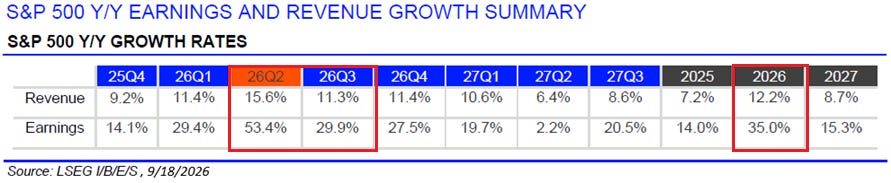
As noted in several recent blog articles, the year over year growth rate of earnings for S&P 500 companies has been extremely robust. As the below table shows, with 496 S&P 500 companies having reported earnings for the second quarter of 2026 the YoY second quarter earnings growth rate is 53.4%, and expectations for Q3 2026 is YoY earnings growth of 29.9%. The significance of this as it relates to the Shiller P/E calculation is the fact the burst in earnings growth is diluted in the denominator of the earnings figure in the Shiller P/E as earnings are smoothed out over a ten-year period.
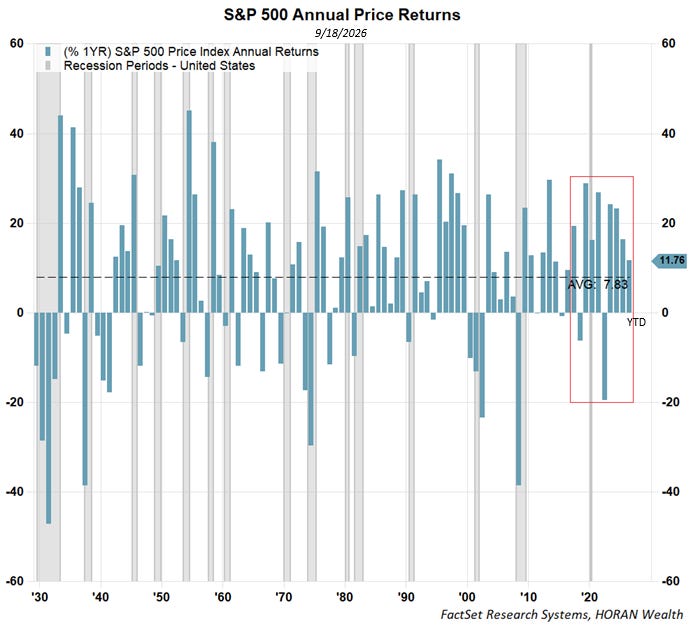
Lastly, the strong earnings growth rate has led to strong equity market returns. The below chart shows the calendar year price return for the S&P 500 Index along with the year-to-date 2026 return. In some respects, one could say strength begets strength as the return over the last ten years has seen only two down years. If one goes back to 2009, investors encountered only two negative returning years out of eighteen for the S&P 500 Index when using the total return for each year.
As noted in the 2017 article, “Even if one believes the market is overvalued, the market does not tend to correct simply because of a stretched valuation. Often some unforeseen catalyst triggers the market correction with valuation a factor in the significance of the prospective decline.” The importance then, strong investor returns have been achieved in a number of the A.I. related companies. If investors are overweight some of these companies in their portfolio, trimming them would be justified. Reasonable valuations can be found in investments/companies outside the A.I. space.


Comments
Log in or sign up to join the conversation.