
Let's talk about USD/TRY and its price action + wave structure.
USD/TRY, Daily
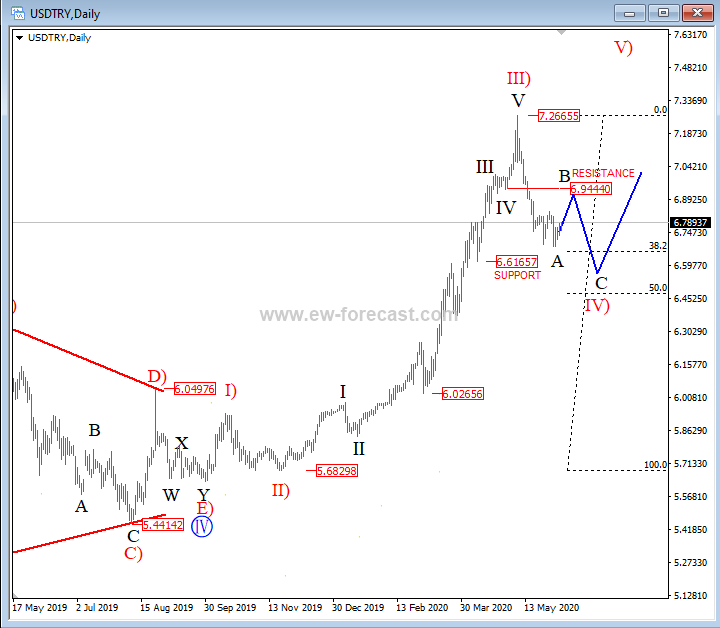
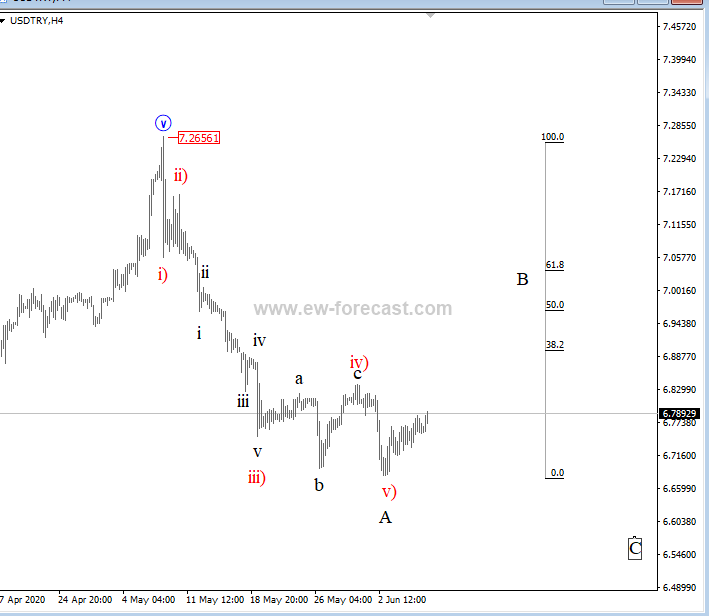
Looking at the daily chart, USD/TRY made a very strong rise in the last couple of months, which was expected based on many evidences we shared with our members. However, after that strong decline from the highs, which we see it as a five-wave drop in the 4-hour chart, it could be the first leg A of a three-wave A-B-C corrective decline within a higher degree wave IV). So, after an intra-day wave B recovery that can retest 7.0 area, be aware of another leg C which can push the price into 38,2% - 50% Fibonacci retracement and 6.60 support area.
When using Elliott Wave, it's important to focus on a minimum three-wave retracement A/1-B/2-C/3 and later then we will be even more confident about in which wave we are.
USD/TRY, 4h
Respect the price action and trade smart!


Comments
Log in or sign up to join the conversation.