


USDMXN has been recovering quite aggressively over the last few weeks, breaking above the trendline resistance of the impulsive channel drawn from the April 2025 highs. This breakout may suggest that a new, higher-degree ABC recovery is underway, with further upside potential as price appears to be only in the first leg, wave A, of this structure.
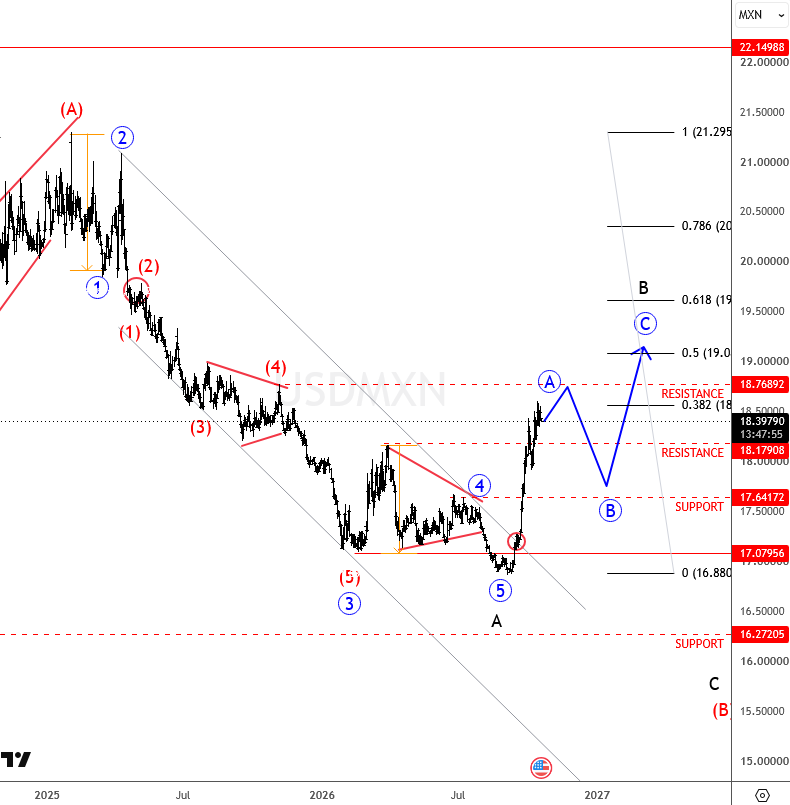
The recent resistance at 18.17, which marked the high of the year, has already been broken, opening the door toward the next resistance at 18.76. Therefore, we would not be surprised to see USDMXN test this higher level in the weeks ahead. However, once wave A matures, watch for a potential pullback in subwave B before the broader recovery continues.
Elliott Wave Basics: The ABC Correction
According to Elliott Wave theory, market trends typically unfold in five-wave impulsive structures, followed by a three-wave corrective pattern labeled A-B-C. After a completed five-wave impulsive decline, an ABC corrective rally can develop as the market retraces part of the previous sell-off. This correction does not necessarily signal a new long-term uptrend; it may simply be a temporary recovery before the broader bearish trend resumes.
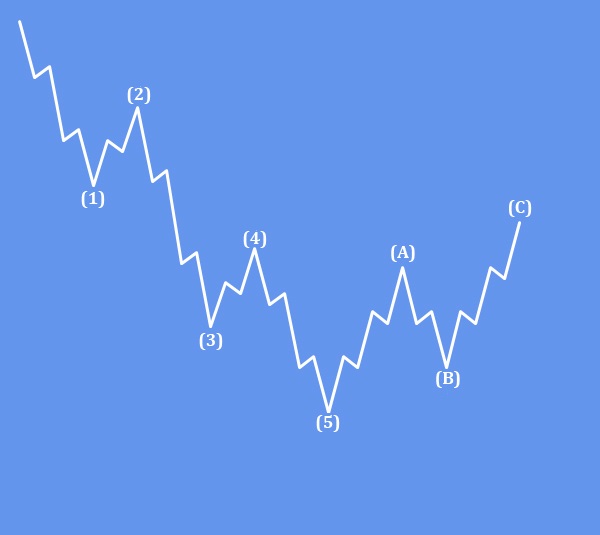
In the current USDMXN setup, the aggressive recovery and breakout above the impulsive channel suggest that the market may be developing a higher-degree ABC correction. If this interpretation is correct, wave A could extend toward 18.76 before a corrective wave B pullback and a potential wave C advance.



Comments
Log in or sign up to join the conversation.