

EUR/USD
4 hour
(Click on image to enlarge)
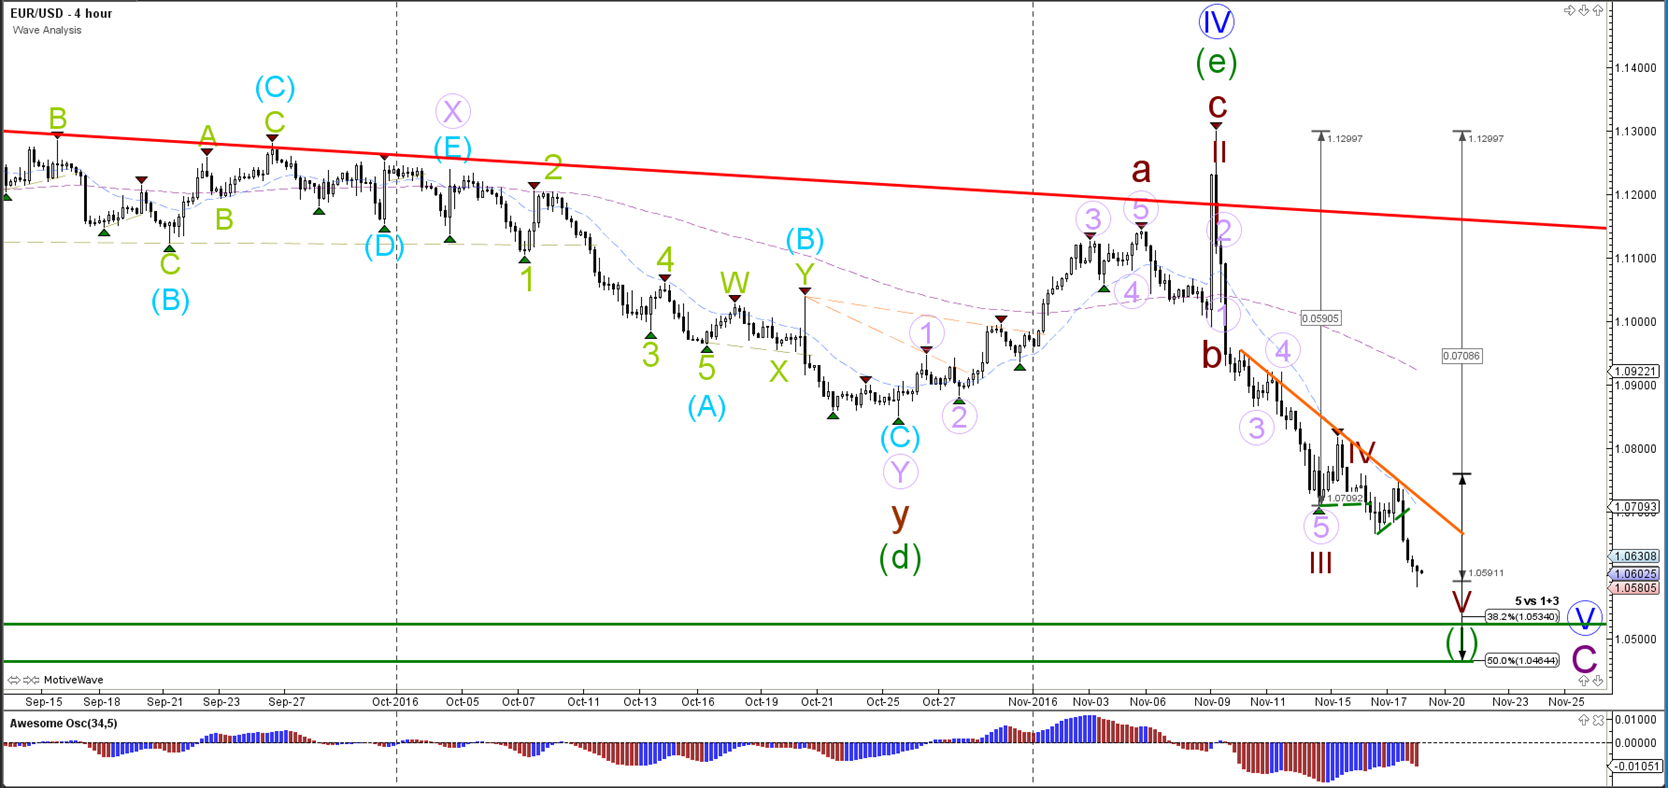
The EUR/USD broke the support trend line (dotted green) and continued with its downtrend. Price is testing the bottoms (green) from the daily chart, which could act as potential bouncing spots.
1 hour
(Click on image to enlarge)
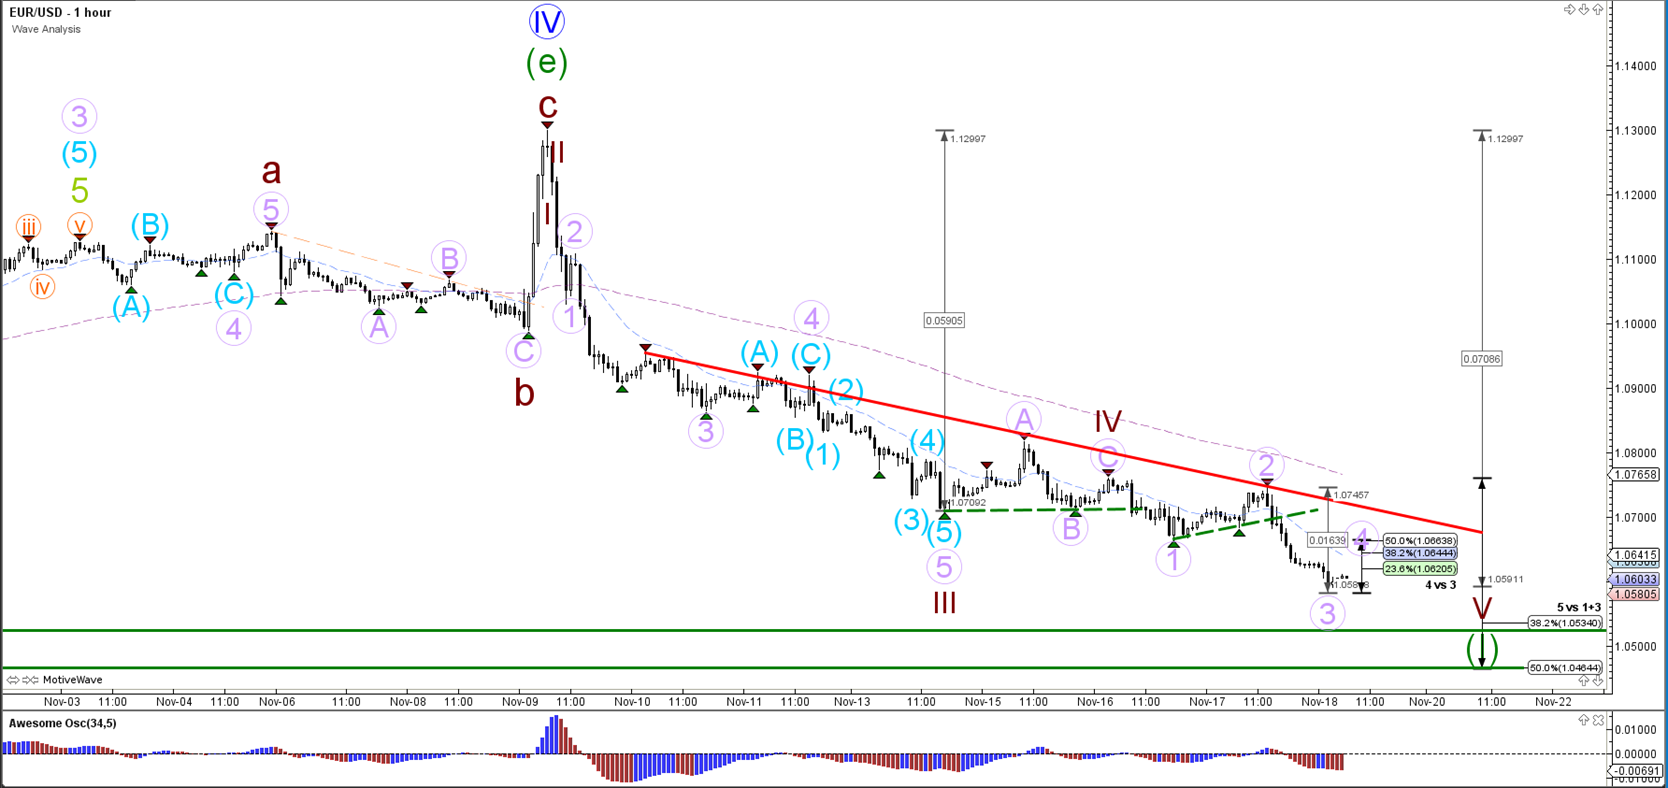
The EUR/USD broke below the support trend line (dotted green) yesterday, which lead to price falling towards the Fibonacci targets. Any retracement beyond the 50% Fibonacci level invalidates the wave 4 (purple).
GBP/USD
4 hour
(Click on image to enlarge)
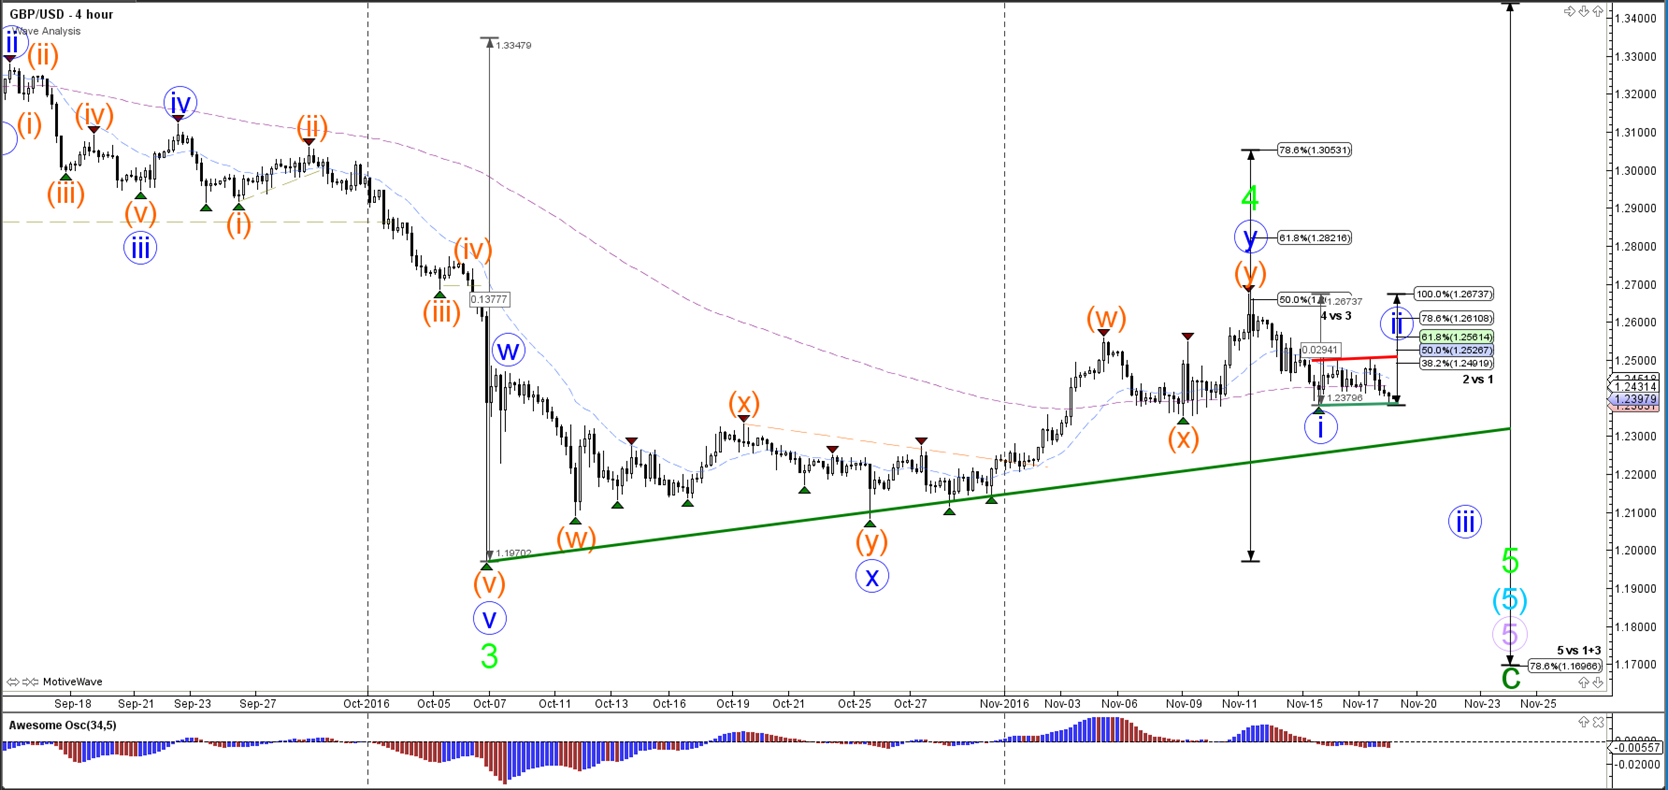
The GBP/USD seems to be developing a bearish wave 1 and 2 (blue). A downtrend continuation is possible if price pushes below support (green) for a wave 3 (blue) whereas the wave 2 (blue) is invalidated if price breaks above the 100% Fib level of wave 2 vs 1.
1 hour
(Click on image to enlarge)
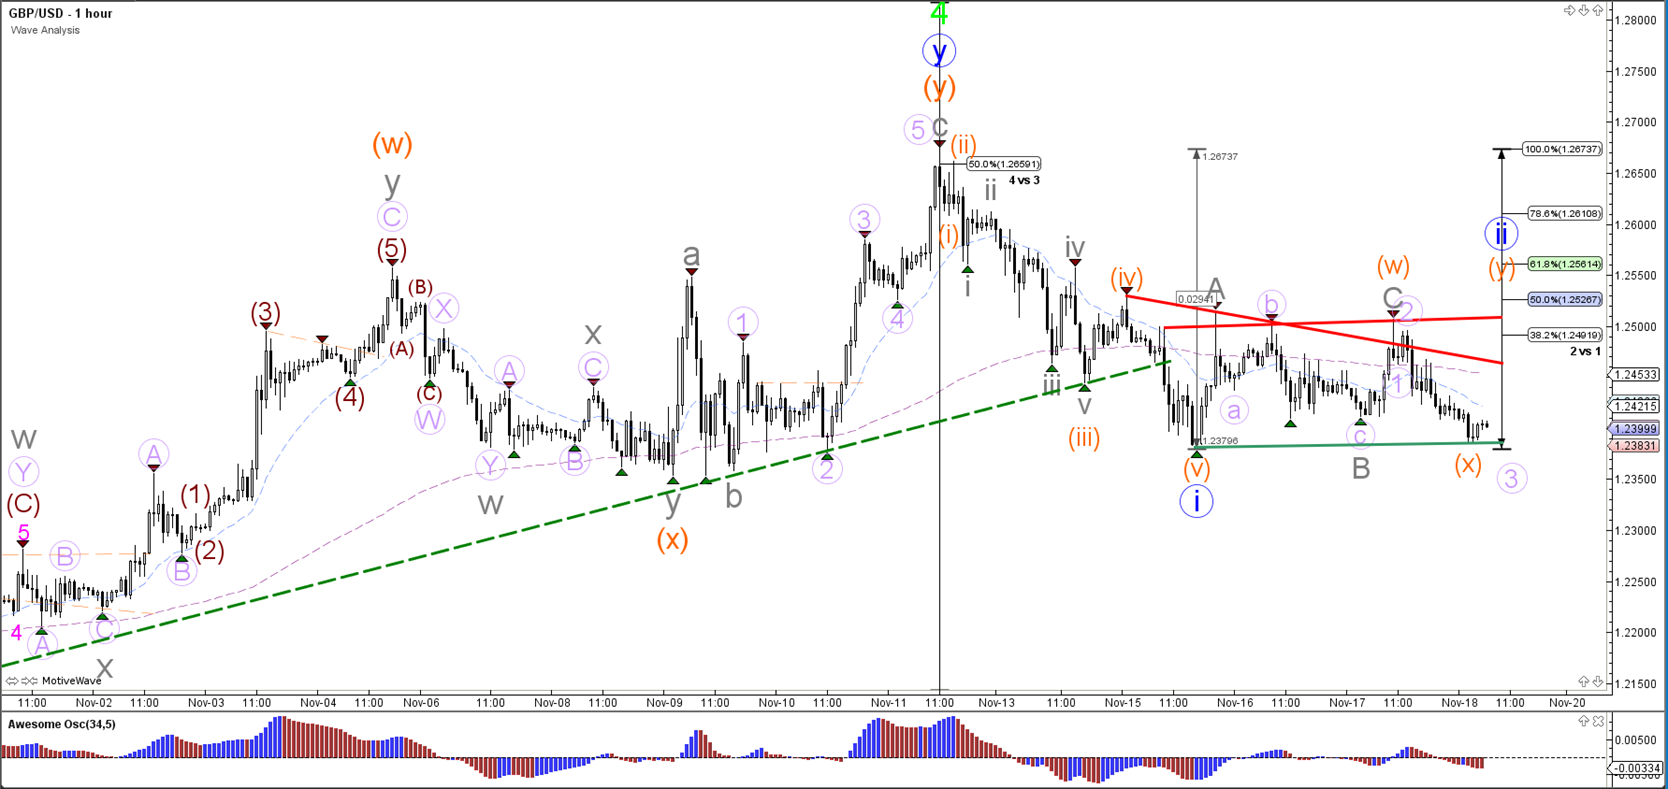
The GBP/USD could be in an extended WXT (orange) correction within wave 2 (blue) if price stays above support (green). A break below support (green) could see price start a potential wave 3 (purple).
USD/JPY
4 hour
(Click on image to enlarge)

The USD/JPY broke above the resistance trend line (dotted red) and psychological 110 level, which is confirming strong bullish momentum often seen in wave 3's (blue / purple). The larger targets are at 112 and 115.
1 hour
(Click on image to enlarge)
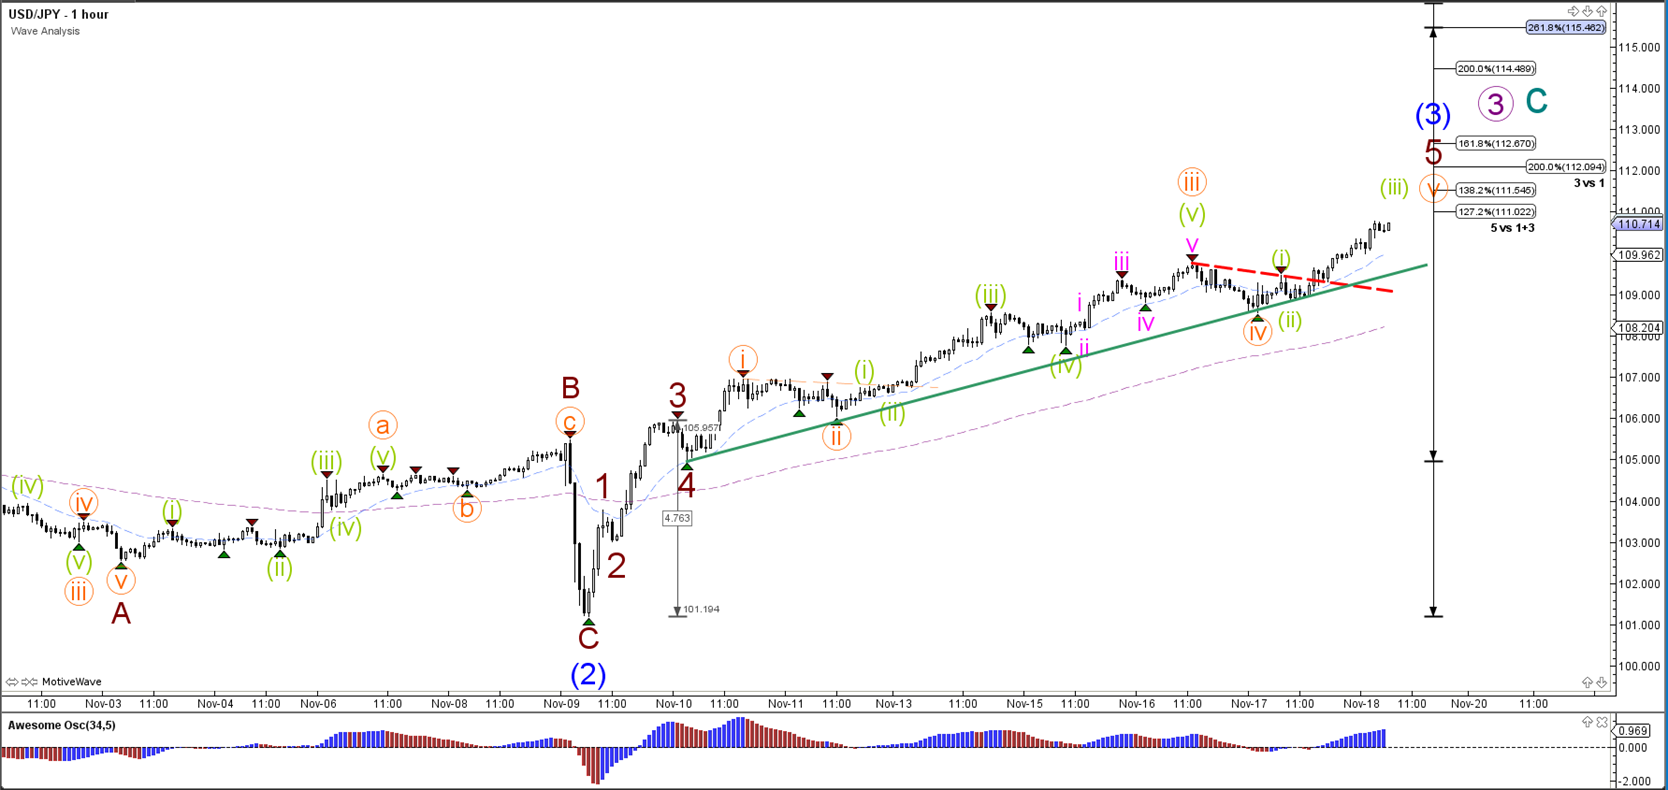
The USD/JPY bullish break above resistance (dotted red) seems to be a wave 3 (green). Once the wave 3 is completed then a wave 4 retracement and wave 5 continuation seem likely within wave 5 (orange).



Comments
Log in or sign up to join the conversation.