

USD/JPY
4 hour
(Click on image to enlarge)
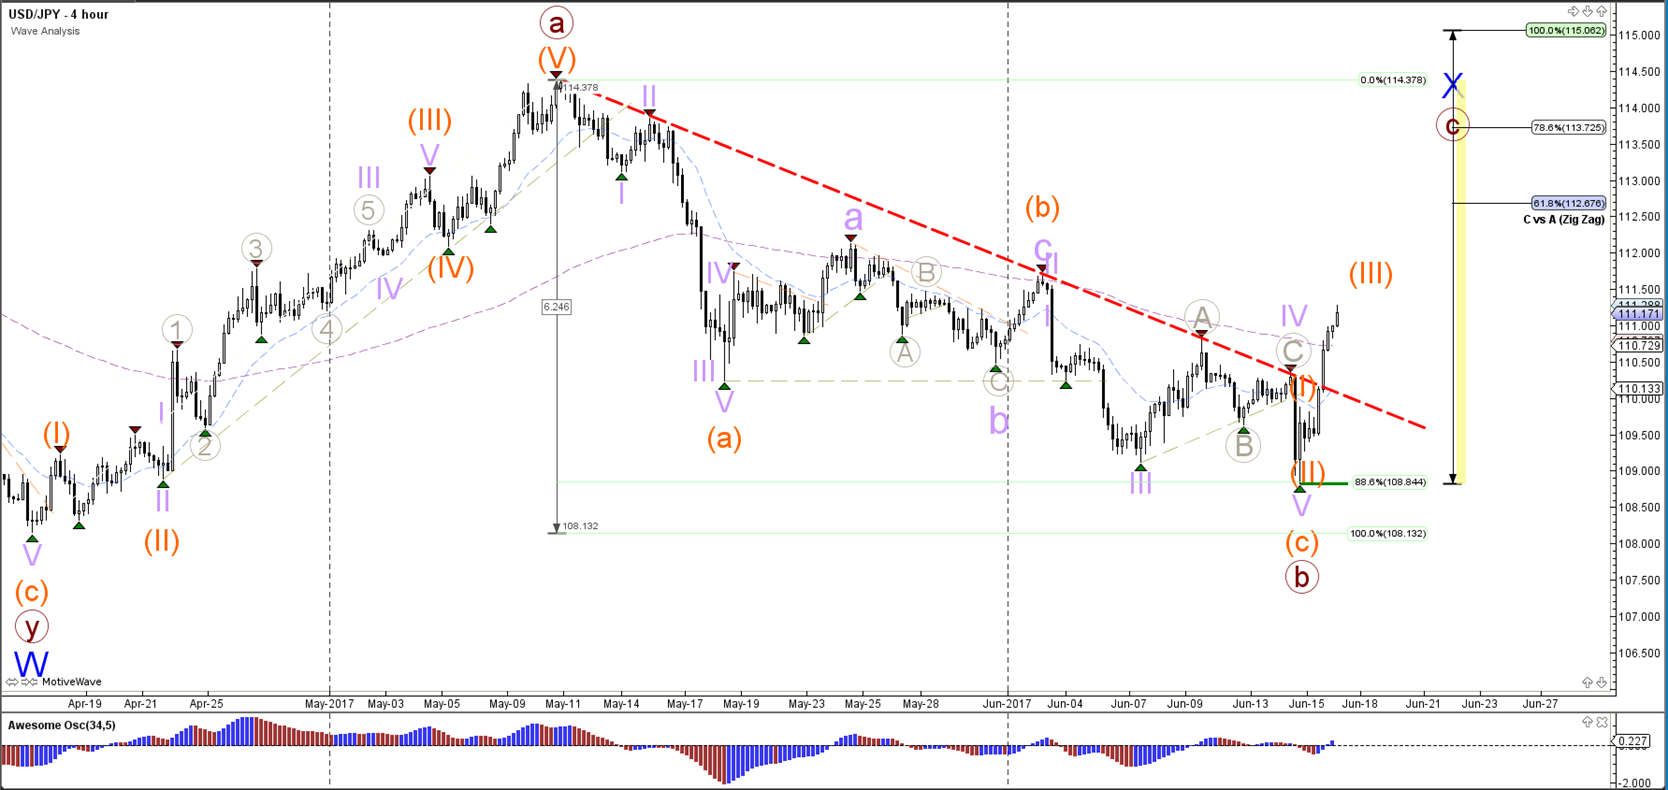
The USD/JPY has strongly bounced at the 88.6% Fibonacci level of wave B (brown) and price managed to break above the resistance trend line (red) as well. Price has most likely completed wave B (brown) and is building bullish momentum (orange 3) within wave C (brown).
1 hour
(Click on image to enlarge)

The USD/JPY broke above resistance (dotted red) and could be building a wave 3 (purple) within a wave 3 (orange).
EUR/USD
4 hour
(Click on image to enlarge)

The EUR/USD is still trapped in between strong support (blue) and resistance (red) and would need to break these levels before a potential trend could start.
1 hour
(Click on image to enlarge)

The EUR/USD indeed completed a wave 4 (blue) and broke below the trend line support (dotted blue). The bearish momentum is most likely a wave 3 (purple) and the triangle (red/blue) could be part of the wave 4 (purple). The potential 5th wave (purple) would most likely complete wave 1 (brown).
GBP/USD
4 hour
(Click on image to enlarge)

The GBP/USD stopped at the 50% Fibonacci level of wave 2 (blue) after completing an ABC zigzag (orange). A bearish breakout below support (blue) could confirm wave 3 (red) whereas the wave 2 of the GBP/USD is invalidated if price breaks above the 100% Fibonacci level of wave 2 (red).
1 hour
(Click on image to enlarge)

The GBP/USD needs to break below support (blue/green) to confirm a potential wave 3 (blue). The Fibonacci levels of wave 2 (blue) could act as resistance.



Comments
Log in or sign up to join the conversation.