

USD/JPY
4 hour
(Click on image to enlarge)
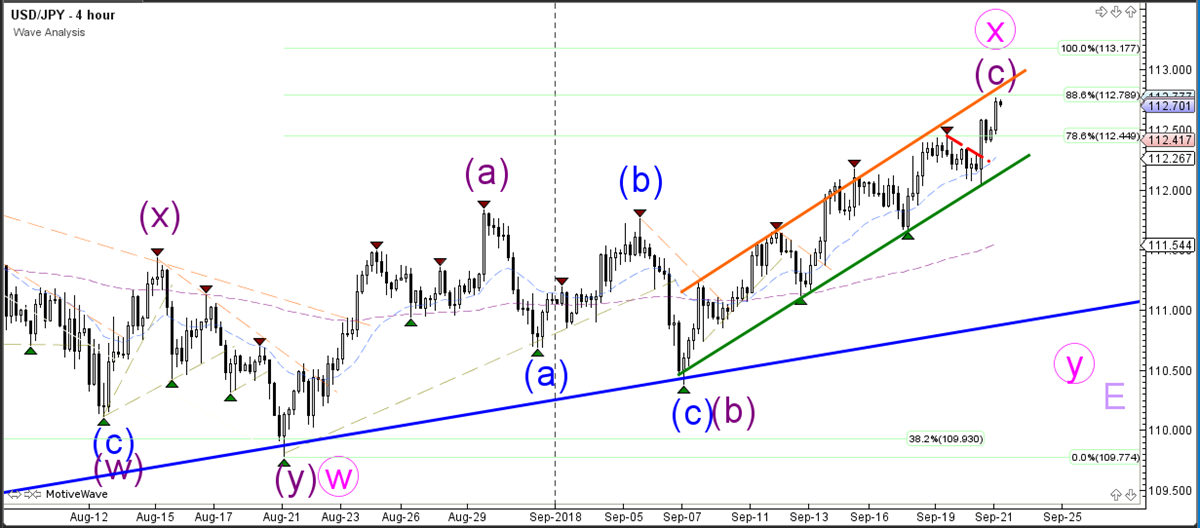
Source: Admiral Markets MT5 with MT5SE Add-on USD/JPY motive wave – 21 September 2018 at 4:00 AM GMT
The USDJPY stayed in the bullish channel and broke above the resistance trend line (dotted orange) and the 78.6% Fibonacci retracement level for a continuation higher. The price is now approaching the next key decision zone, which is the 88.6% Fibonacci retracement level. The USDJPY currency pair will either make a bearish bounce or a bullish breakout.
1 hour
(Click on image to enlarge)
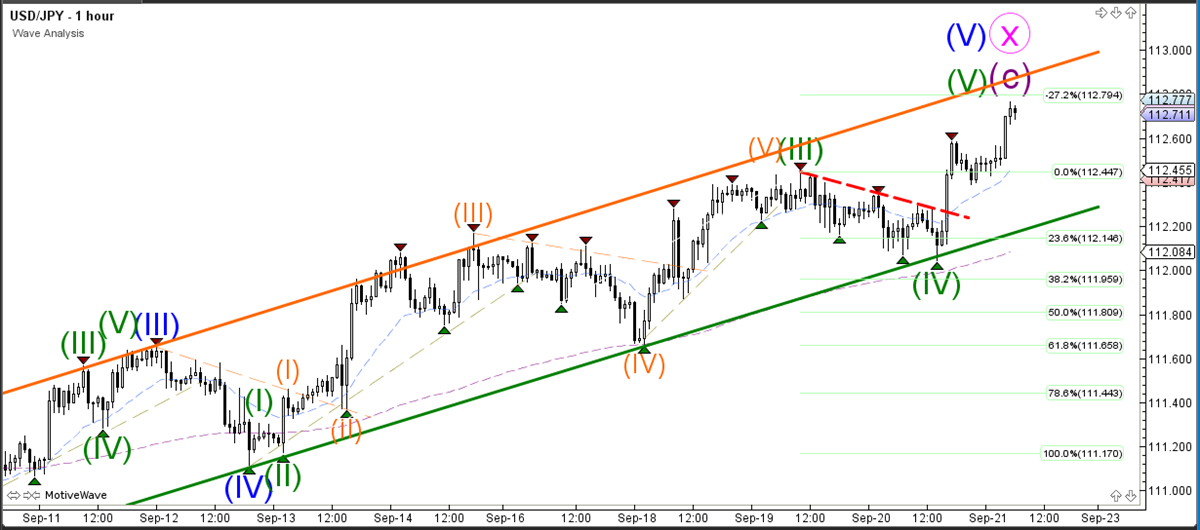
Source: Admiral Markets MT5 with MT5SE Add-on USD/JPY motive wave – 21 September 2018 at 4:00 AM GMT
The USD/JPY breakout has extended the uptrend. The price could still be in a corrective wave X (pink) if it bounces at the deep Fibonacci level. A break above the 88.6% Fib could make the wave X pattern less likely however.



Comments
Log in or sign up to join the conversation.