
US DOLLAR PULLS BACK, FINDS SUPPORT AT PRIOR RESISTANCE
The bullish trend in the US Dollar pulled back yesterday, but buyers appeared to remain motivated as support began to develop off of last week’s resistance around the 96.68 level. With this week now hitting the half-way point, markets have already heard from multiple FOMC members and a few speeches of note remain. Later today, Patrick Harker will speak at Noon on the Economic Outlook, and again tomorrow at 11 AM ET. Friday brings comments from Rafael Bostic on the topic of Workforce Development, and this takes place around the release of U. of Mich Sentiment numbers at 10 AM. Also on the economic calendar is the release of tomorrow’s Advance Retail Sales numbers out of the US.
US DOLLAR EIGHT-HOUR PRICE CHART
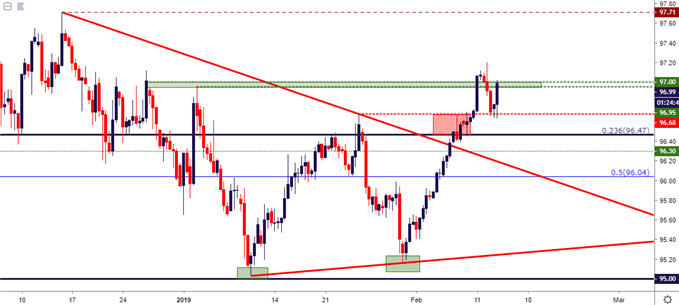
Chart prepared by James Stanley
USD/JPY TO NEXT FIBONACCI LEVEL
The bullish breakout in USDJPY has continued through this week, and even with the pullback in DXY yesterday, USDJPY bulls have continued to push. Prices are now approaching a potential area of resistance on the chart at 110.86, which is the 61.8% Fibonacci retracement of the November 2017 – March 2018 major move. Of note are the support/resistance inflections derived off of those retracement levels so far this year, with each of the 23.6, 38.2 and 50% markers all seeing some element of reaction. Most recently, that 50% marker was attached to the 110.00 psychological level to create a ‘zone’ that saw a range build in the latter-portion of last week, leading to this week’s topside breakout.
USD/JPY FOUR-HOUR PRICE CHART
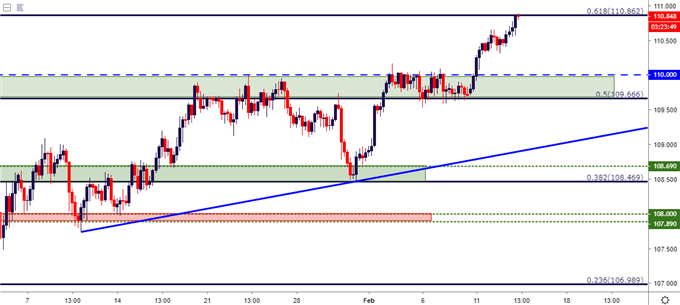
Chart prepared by James Stanley
USD/CAD BOUNCES FROM 1.3200 TEST
On the other side of the US Dollar or for those looking at short-side USD strategies, USDCAD remains of interest. I had looked at this in this week’s FX Setups as prices created a lower-high point of resistance last week, and that came just after a fresh lower low printed in the opening days of February. A follow-through lower-high printing this week inside of the 1.3325 level kept the door open for bearish biases, and that theme has thus far continued as prices tilted-down to the 1.3200 level overnight.
Can bears continue to push? That’s the big question surrounding USD/CAD at the moment, as the continued build of lower-lows and lower-highs can keep the door open for a larger bearish move in the pair.
USD/CAD FOUR-HOUR PRICE CHART
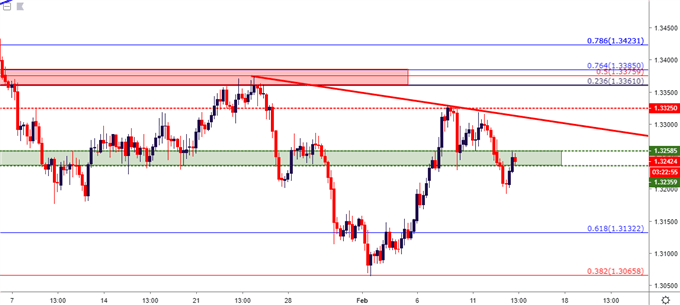
Chart prepared by James Stanley
EURO RALLY STOPPED COLD AS SPANISH POLITICS ENTERS THE RISK PICTURE
The current range on the daily chart of EUR/USD has held through some pretty dramatic events. Last quarter saw the debt standoff between Italy and the European Commission, and despite the historic event of the EC rejecting Italy’s budget, the pair remained range-bound. The topside of that range was tested shortly after the open of the New Year, but that theme couldn’t last, and price action had soon re-submitted to the prior two-month range.
The February open, thus far, has seen a different tonality take-over. A consistent spate of selling developed as the page turned into a fresh month, and that bearish trend remained in-tact into yesterday’s trade. But as prices had started to test the longer-term support zone, sellers soon dried up and prices pushed-higher by as much as 85 pips. That rally lasted all the way into the 1.1340 area, at which point sellers have started to re-enter the picture.
The big question at this point, is whether the longer-term range will hold with prices tilting-higher; or whether the short-term momentum that showed up in February can make a deeper dent into that support zone or, perhaps, even break below the area to spark a longer-term bearish trend in the pair?
EUR/USD TWO-HOUR PRICE CHART
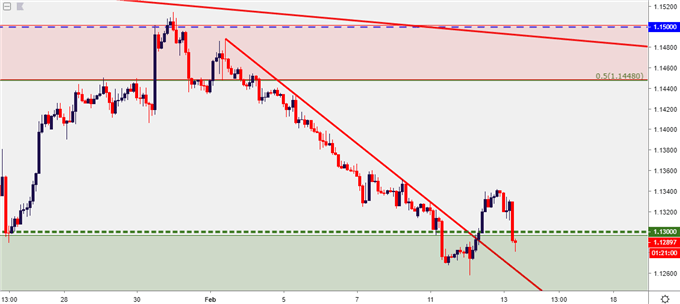
Chart prepared by James Stanley


Comments
Log in or sign up to join the conversation.