

The USD/JPY price continues to move sideways in the short term. It seems that the price action could develop a triangle pattern on the 4-hour chart. Breaking out from this pattern could bring us a clear direction. The pair is traded at 109.70 level at writing and is waiting for a bullish or for a bearish spark before developing an important movement.
The price has dropped a little even if the Dollar Index has reached fresh new highs. The Japanese Yen was strongly bullish as the JP225 (Nikkei) has plunged in the short term. The JPY has received a helping hand from the Japanese National Core CPI, which has dropped only by 0.2% even if the traders have expected to see a 0.4% drop.
Right now, the USD/JPY pair is trying to increase as the Nikkei and the Dollar Index is trading in the green. The Dollar Index is still bullish after the US Unemployment Claims indicator was reported better than expected at 348K versus 362K expected.
Unfortunately, the price could drop anytime if JP225 resumes its downside movement. Technically, the Japanese stock index dropped below former lower lows signaling massive selling pressure.
USD/JPY price technical analysis: Key levels to watch
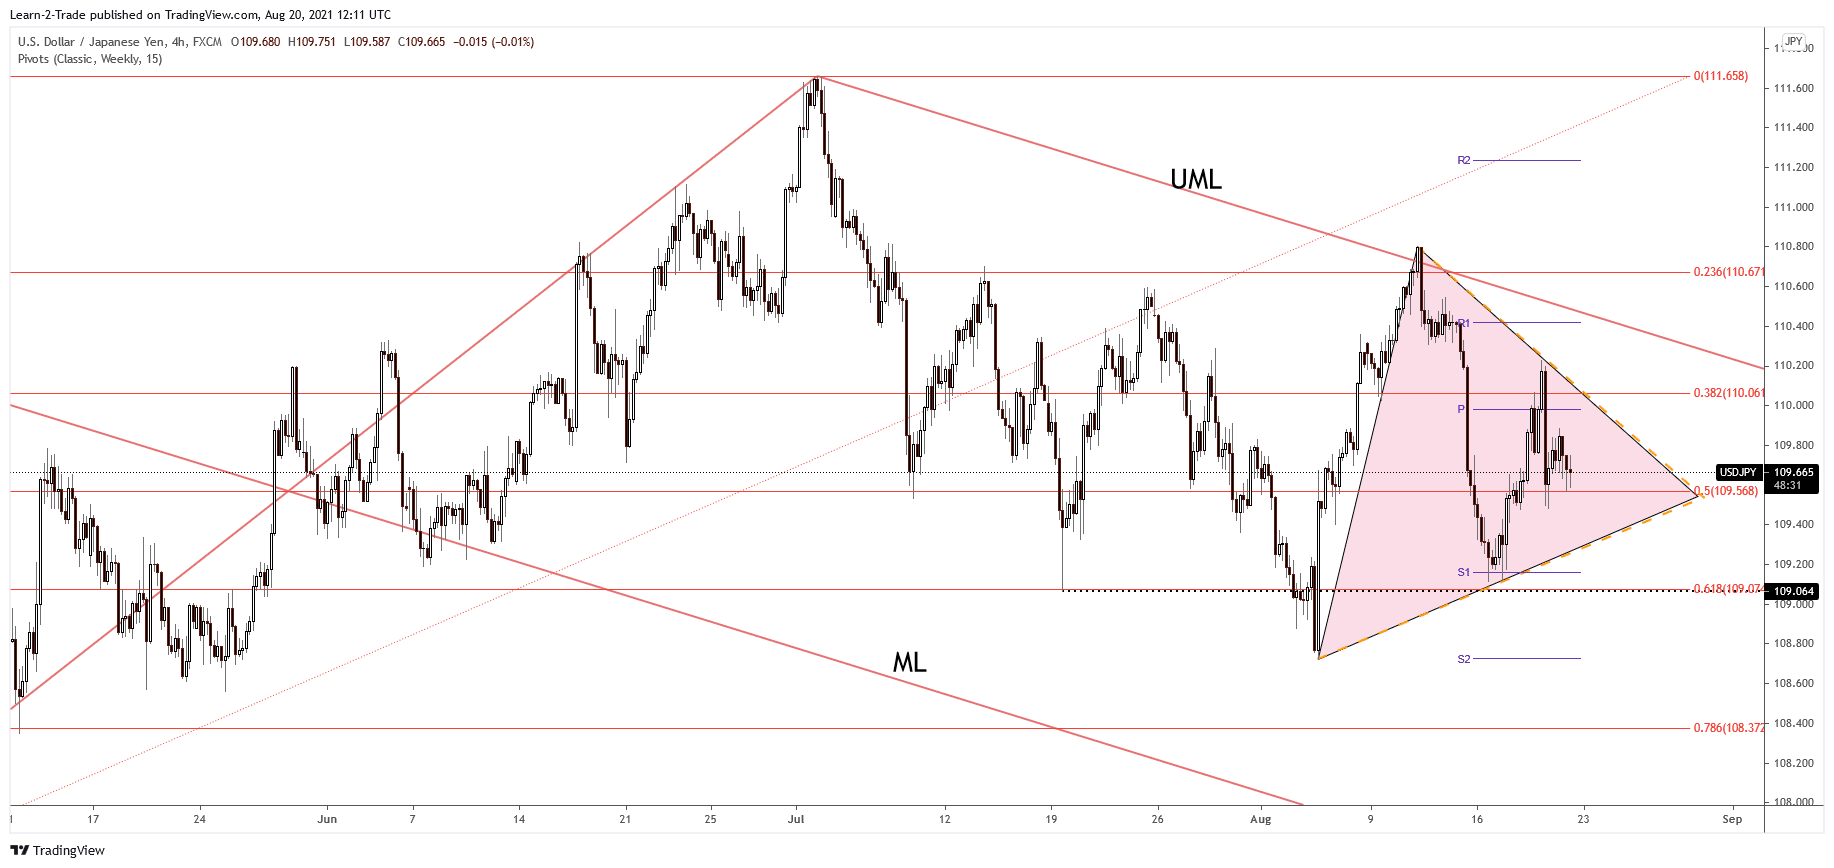
USD/JPY 4-hour price chart
The USD/JPY price plunged from above the 38.2% retracement level, and now it has found support on the 50% (109.56) retracement level. It’s located in a neutral zone. Only an upside breakout or a breakdown from this pattern could offer a clear direction.
Technically, the price action has signaled that the downside is limited and that the USD/JPY pair could rise again. However, descending pitchfork’s upper median line (UML) is seen as a critical dynamic resistance. Breaking above it may announce an important upwards movement towards 111.65 higher high.
The upside scenario could be invalidated by a downside breakout from this pattern and if the rate will drop and stabilize below the 61.8% retracement level.



Comments
Log in or sign up to join the conversation.