


The USD/JPY pair extends the range play through the Asian session on Friday, stalling this week's solid recovery from its lowest level since May, touched in the aftermath of a joint US-Japan intervention. Spot prices currently trade near the top end of the weekly range, around mid-158.00s, as traders keenly await the crucial US Nonfarm Payrolls (NFP) report for a fresh impetus.
In the meantime, persistent geopolitical uncertainties, reviving inflation fears, and bets for at least one interest rate hike by the US Federal Reserve (Fed) act as a tailwind for the US Dollar (USD). The Japanese Yen (JPY), on the other hand, remains depressed on the back of concerns about Japan's worsening fiscal condition. Moreover, a fall in Japan's Household Spending for the seventh straight month weakens the case for a Bank of Japan (BoJ) rate hike in September, further weighing on the JPY and acting as a tailwind for the USD/JPY pair.
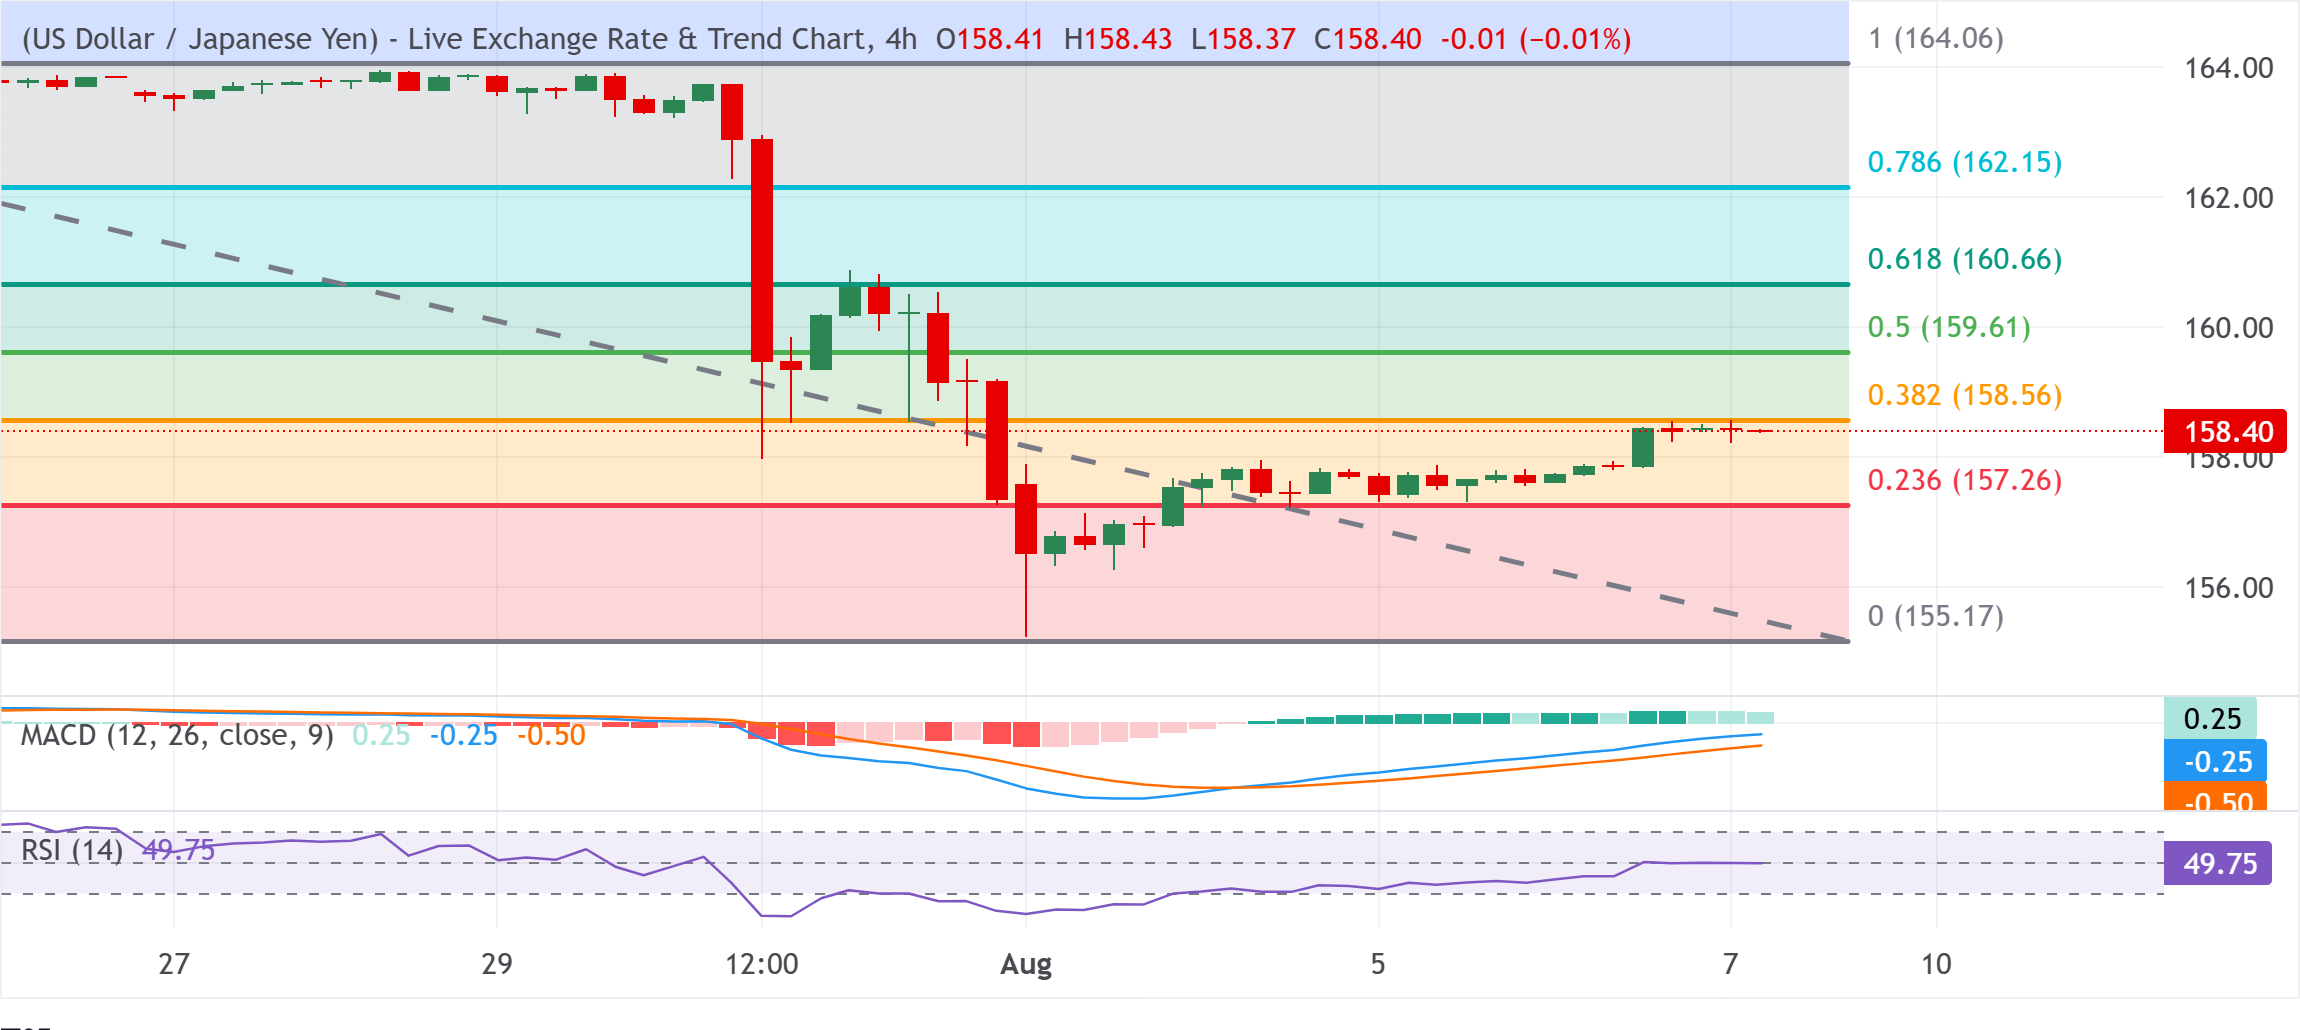
From a technical perspective, spot prices keep a capped tone near the 38.2% Fibonacci retracement level of a sharp slide from a four-decade high, touched in July. Meanwhile, the Moving Average Convergence Divergence (MACD) now prints in positive territory, hinting at improving short-term momentum on the 4-hour chart. However, the Relative Strength Index (RSI) around 50 suggests a neutral, consolidative backdrop rather than a decisive trend shift, making it prudent to wait for a move beyond the current level before placing fresh bullish bets.
A further move up beyond the 38.2% Fibo., near 158.55, is likely to confront resistance at the 50.0% retracement at 159.61 and the 61.8% level at 160.66, where further rallies could stall. On the downside, initial support appears at the 23.6% retracement at 157.26, ahead of the structural floor near 155.17. A sustained break below 157.26 is likely to open the way for a deeper correction toward that lower zone.
USD/JPY 4-hour chart
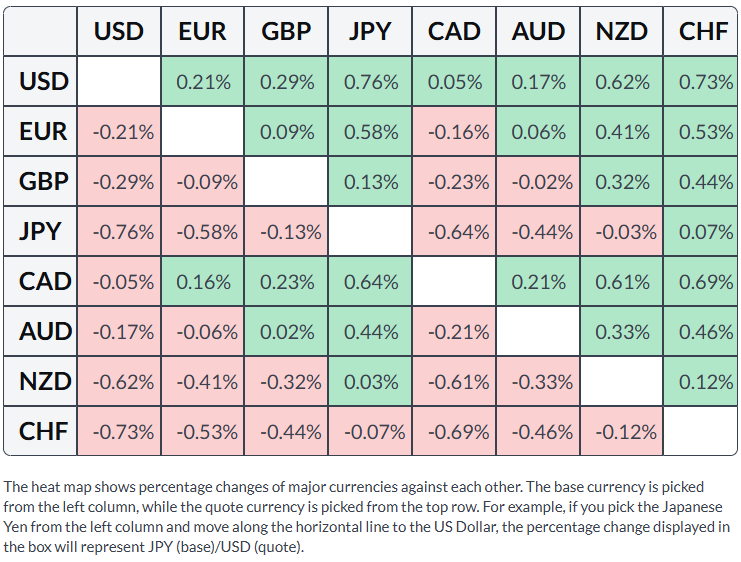
Japanese Yen Price This Week
The table below shows the percentage change of Japanese Yen (JPY) against listed major currencies this week. Japanese Yen was the strongest against the Swiss Franc.



Comments
Log in or sign up to join the conversation.