

USD/JPY
(Click on image to enlarge)

Chart - Created Using FXCM Marketscope 2.0
- USD/JPY has triggered an oversold signal as the Relative Strength Index (RSI) dips below 30, but the pair stands at risk for a further decline especially if the oscillator makes its way back towards the lows from earlier this year.
- With hopes of seeing a meaningful announcement at the Group of 20 meeting in Shanghai, market sentiment may deteriorate further in the days ahead should the community of global central bankers & finance ministers struggle to meet on common ground.
- Will keep a close eye on the downside targets as the RSI pushes back into oversold territory, with the next key region of interest coming in around 110.50 (61.8% expansion) followed by 109.50 (50% expansion).

- Despite the near-term decline in the exchange rate, the DailyFX Speculative Sentiment Index (SSI)shows the retail FX crowd has been net-long USD/JPY since January 29, with the ratio hitting an extreme earlier this month as it climbed to +3.00.
- The retail crowd appears to be fading the near-term decline in USD/JPY as long positions are 12.4% higher from the previous week, with the ratio working its way back towards recent extremes as it climbs to +2.26.
US DOLLAR
|
Index |
Last |
High |
Low |
Daily Change (%) |
Daily Range (% of ATR) |
|
DJ-FXCM Dollar Index |
12126.69 |
12159.6 |
12114.24 |
0.06 |
73.21% |

(Click on image to enlarge)
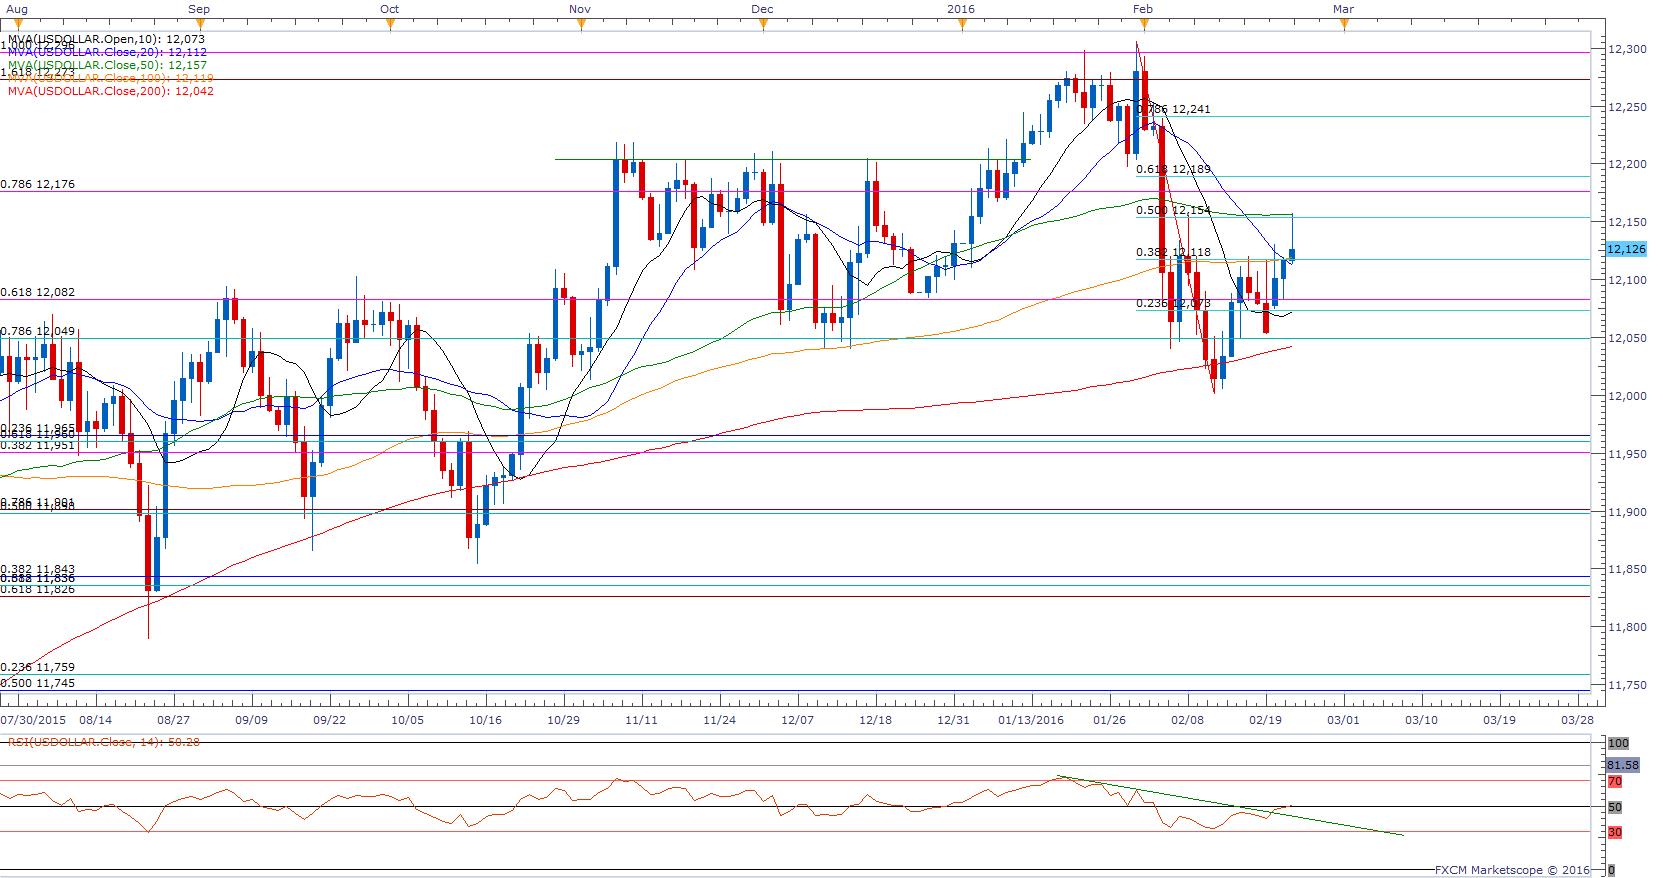
Chart - Created Using FXCM Marketscope 2.0
- The USDOLLAR falls back from a fresh weekly high of 12,158 as the data prints coming out of the world’s largest economy continue to highlight a mixed outlook for growth & inflation, but the bullish break on the RSI may foreshadow a larger advance over the days ahead as the greenback climbs out of the recent range and tests the 50-Day SMA (12,157).
- Despite signs of a slowing recovery, recent comments from Richmond Fed President Jeffrey Lacker suggest the Federal Open Market Committee (FOMC) remains on course to implement higher borrowing-costs in 2016 as central bank officials remain upbeat on the economy and look for a ‘consumer-led’ recovery.
- With the RSI breaking out of the bearish formation from earlier this year, topside targets remain in focus with the next region of interest coming in around 12,176 (78.6% expansion) to the 12,200 pivot.



Comments
Log in or sign up to join the conversation.