

(Click on image to enlarge)
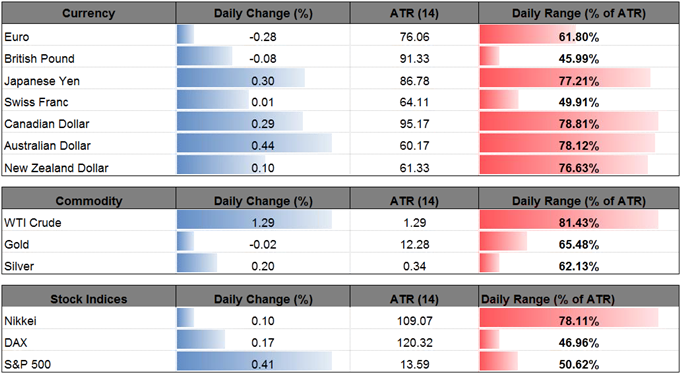
|
Ticker |
Last |
High |
Low |
Daily Change (pip) |
Daily Range (pip) |
|
USD/JPY |
111.73 |
112.23 |
111.56 |
34 |
67 |
USD/JPY stands at risk for further losses as it extends the series of lower-highs carried over from the previous week, while U.S. Treasury yields remain under pressure and give back the rebound from June.
With Fed Fund Futures still highlighting a 50/50 chance for a December rate-hike, it seems as though the recent remarks from Fed Chair Janet Yellen have tamed market expectations as the central bank head argues the benchmark interest rate ‘would not have to rise all that much further to get to a neutral policy stance.’ In turn, USD/JPY may exhibit a more bearish behavior over the near-term as the Federal Open Market Committee (FOMC) is expected to retain the current policy at the next rate decision on July 26.
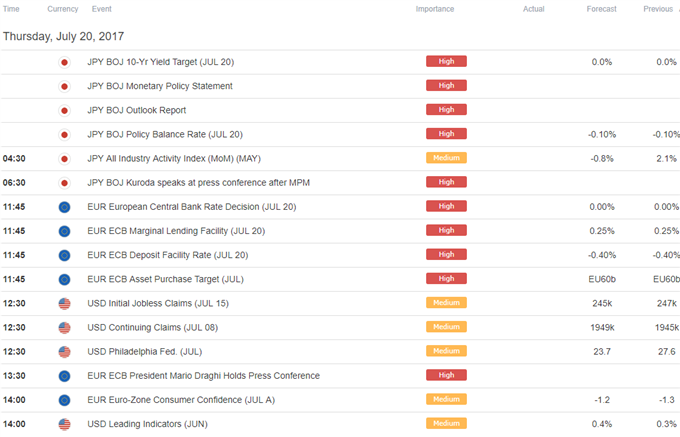
At the same time, the Bank of Japan (BoJ) meeting may do little to shift the near-term outlook for the dollar-yen exchange rate as Governor Haruhiko Kuroda and Co. continue to embark on the Quantitative/Qualitative Easing (QQE) Program with Yield-Curve Control.
USD/JPY Daily
(Click on image to enlarge)
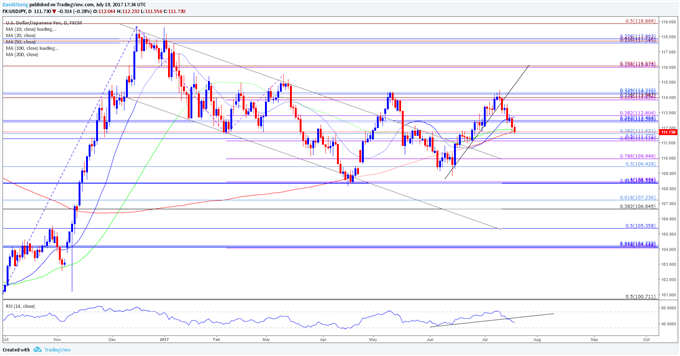
Chart - Created Using Trading View
- The rebound from the June-low (108.80) may continue to unravel as the bearish trigger in the Relative Strength Index (RSI) continues to unfold, with USD/JPY clearing the monthly opening range.
- Break/close below the near-term support zone around 111.10 (61.8% expansion) to 111.60 (38.2% retracement) opens up the next region of interest around 109.40 (50% retracement) to 109.90 (78.6% expansion) followed by the June-low (108.80), which sits just above the Fibonacci overlap coming in at 108.30 (61.8% retracement) to 108.40 (100% expansion).
|
Ticker |
Last |
High |
Low |
Daily Change (pip) |
Daily Range (pip) |
|
EUR/USD |
1.1522 |
1.1557 |
1.1510 |
32 |
47 |
EUR/USD pullback from a fresh 2017-high (1.1583), but the fresh developments comings out of the European Central Bank (ECB) may boost the appeal of the single-currency should President Mario Draghiand Co. continue to alter the outlook for monetary policy.
Even though the ECB is widely anticipated to retain the zero-interest rate policy (ZIRP) in July, the central bank may start to taper its asset-purchases over the coming months as the quantitative easing (QE) program is set to expire in December. Unless the Governing Council pushes back the deadline, the material shift in EUR/USD behavior may persist throughout the second-half of the year as ECB officials show a greater willingness to conclude the easing-cycle and note that ‘very adverse scenarios for the inflation outlook had become less likely, in particular as deflation risks had largely vanished.’
However, EUR/USD stand at risk of facing a bearish scenario if the ECB merely attempts to buy more time, and the pair consolidate over the near-term should the central bank show a greater willingness to carry the QE program into 2018.
EUR/USD Daily
(Click on image to enlarge)
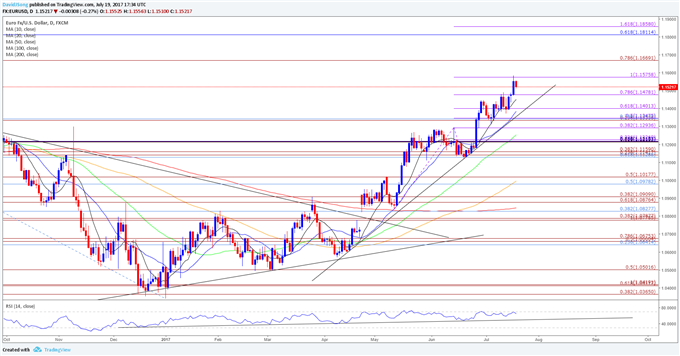
Chart - Created Using Trading View
- EUR/USD appears to have made a failed attempt to test the 2016-high (1.1616) especially as the Relative Strength Index (RSI) appears to be deviating with price and struggles to push above 70; failure to close above the 1.1580 (100% expansion) hurdle raises the risk for a near-term pullback in the euro-dollar exchange rate as the momentum indicator turns around ahead of overbought territory.
- The former resistance-zone around 1.1480 (78.6% expansion) sits on the radar going into the ECB meeting, with the next downside region of interest coming in around the 1.1400 (61.8% expansion) handle, followed by the Fibonacci overlap around 1.1330 (23.6% expansion) to 1.1350 (50% expansion).
- Nevertheless, EUR/USD may extend the advance from earlier this month should the Governing Council layout a more detailed exit strategy, with a break of the 1.1580 (100% expansion) opening up the next topside hurdle around 1.1670 (78.6% expansion).
(Click on image to enlarge)



Comments
Log in or sign up to join the conversation.