

4 hour

Source: Admiral Markets MT5 with MT5SE Add-on USD/JPY motive wave – Accessed 12 October 2018 at 5:30 AM GMT
The USD/JPY currency pair made a bullish bounce at the 61.8% Fibonacci retracement level. A bullish break above the resistance trend line (red) could indicate the end of a wave 4 (blue) pattern, and the start of the wave 5 (blue). A bearish break indicates a new wave pattern indicated by the 5 bearish waves (red).
1 hour

Source: Admiral Markets MT5 with MT5SE Add-on USD/JPY motive wave – Accessed 12 October 2018 at 5:30 AM GMT
The USD/JPY currency pair has either completed a bearish ABC (orange), or is building a 5 wave (red) pattern, which will depend on the candlestick patterns that emerge at the support and resistance trend lines.
Weekly
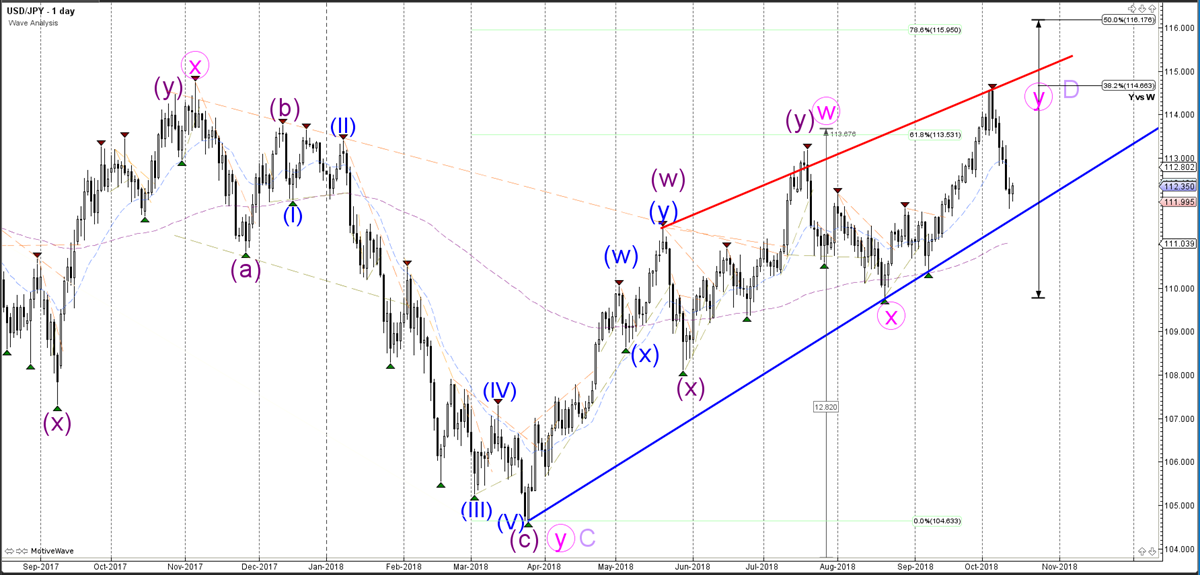
Source: Admiral Markets MT5 with MT5SE Add-on USD/JPY motive wave – Accessed 12 October 2018 at 5:30 AM GMT
The USD/JPY currency pair is testing a key support trend line (blue), which is a key bounce or break zone.



Comments
Log in or sign up to join the conversation.