
USD/JPY
4 hour
(Click on image to enlarge)
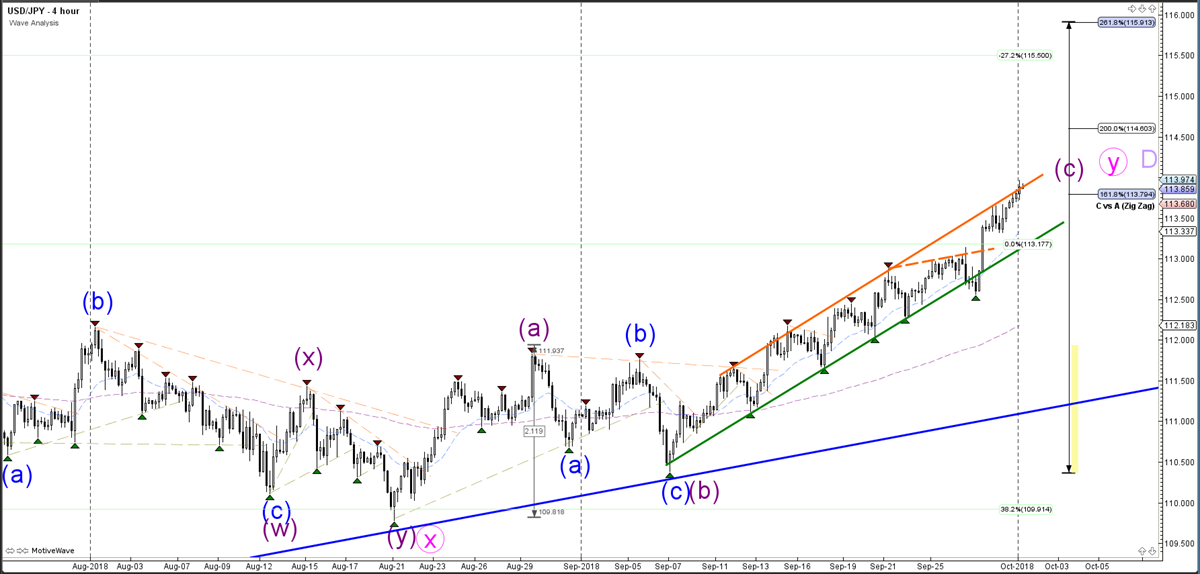
Source: Admiral Markets MT5 with MT5SE Add-on USD/JPY motive wave – Accessed 1 October 2018 at 6:00 AM GMT
The USDJPY currency pair remains in the uptrend channel, and the price is now approaching the resistance trend line of that channel. As long as the price remains in the channel, there is more space to move up towards the Fibonacci target levels. The current bullish momentum and candlesticks are part of the wave C (purple) of wave Y of D.
1 hour
(Click on image to enlarge)
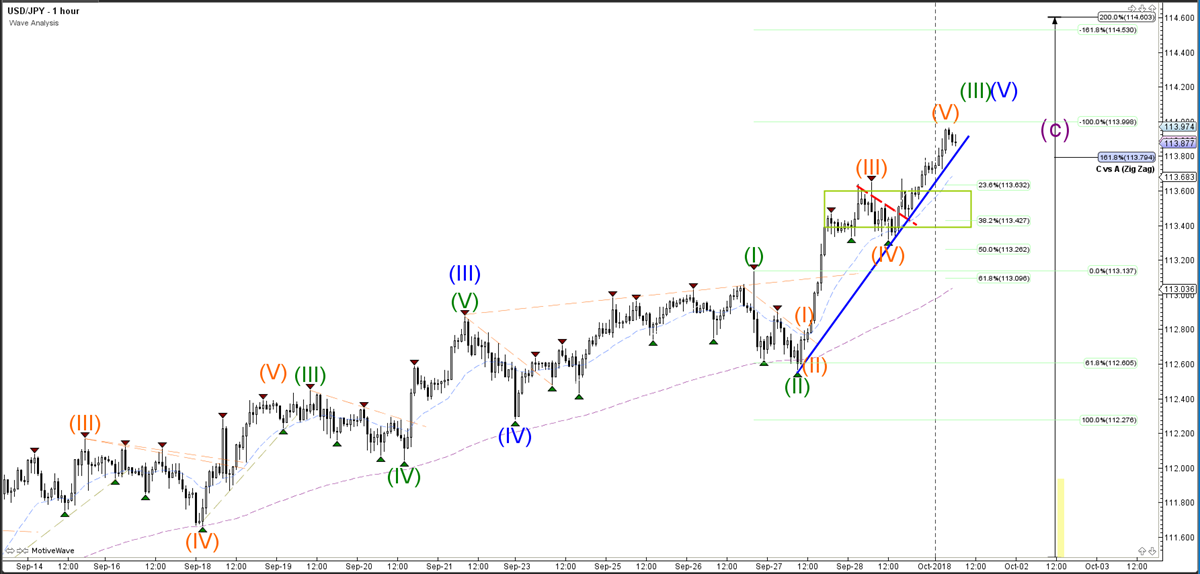
Source: Admiral Markets MT5 with MT5SE Add-on USD/JPY motive wave – Accessed 1 October 2018 at 6:00 AM GMT
The USD/JPY currency pair is showing strong bullish momentum at the moment which is probably part of a wave 3 (green). A break below the support trend line (blue) could indicate a larger retracement, but the Fibonacci retracement levels could act as potential support for a bullish continuation.
Daily
(Click on image to enlarge)
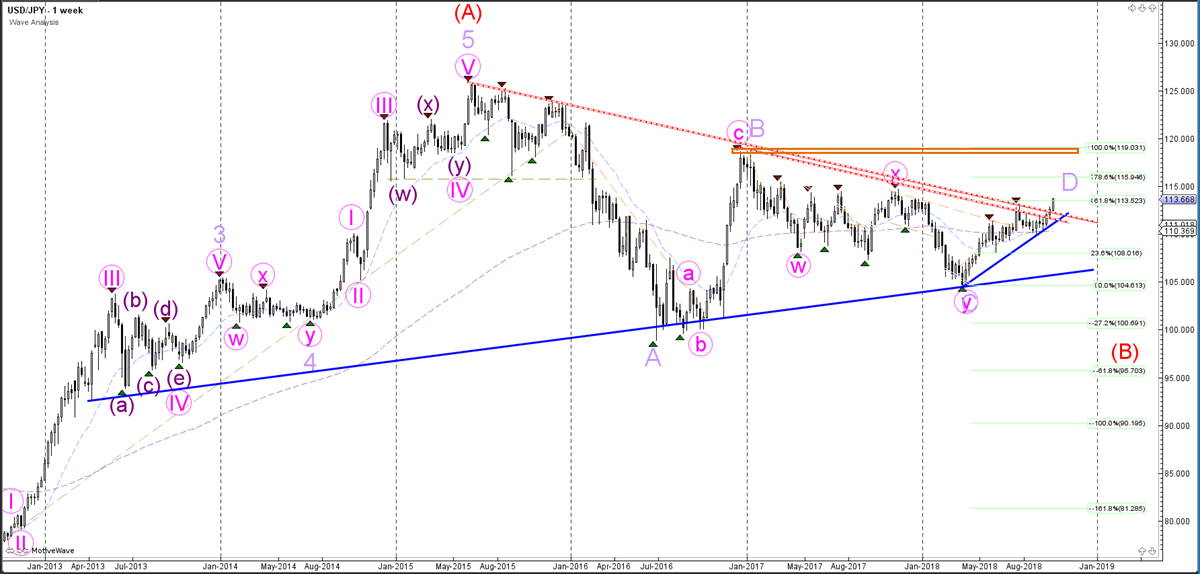
Source: Admiral Markets MT5 with MT5SE Add-on USD/JPY motive wave – Accessed 1 October 2018 at 6:00 AM GMT
The USD/JPY is showing a bullish breakout above the resistance trend lines (dotted red) and 61.8% Fibonacci levels on the weekly chart. The breakout, however, could be part of the triangle (wave ABCDE) pattern, as long as the price stays below the 78.6-100% Fib resistance levels. A bullish breakout indicates more upside.


Comments
Log in or sign up to join the conversation.