

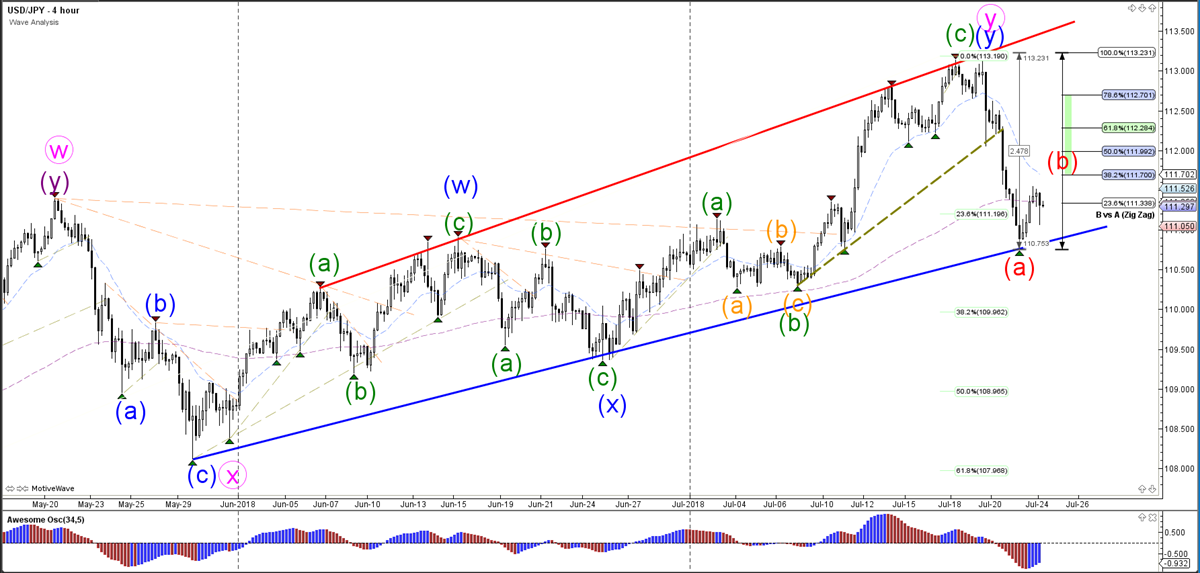
Eventually a bearish bounce is expected due to the ABC zigzag pattern. Price should stop at the Fibonacci levels of wave B vs A whereas a break above 100% Fib level invalidates the bearish ABC.
USD/JPY
4 hour
(Click on image to enlarge)
Source: Admiral Markets MT5 with MT5SE Add-on USD/JPY motive wave
Despite the strong bearish momentum on the USD/JPY, price made a bullish bounce at the support trend line (blue). This could confirm the end of wave A (red) and the start of wave B (red). Eventually a bearish bounce and break is expected due to a potential ABC (red) zigzag pattern. Price should stop at the Fibonacci levels of wave B vs A whereas a break above the 100% Fibonacci level invalidates the bearish ABC.
1 hour
(Click on image to enlarge)
Source: Admiral Markets MT5 with MT5SE Add-on USD/JPY motive wave
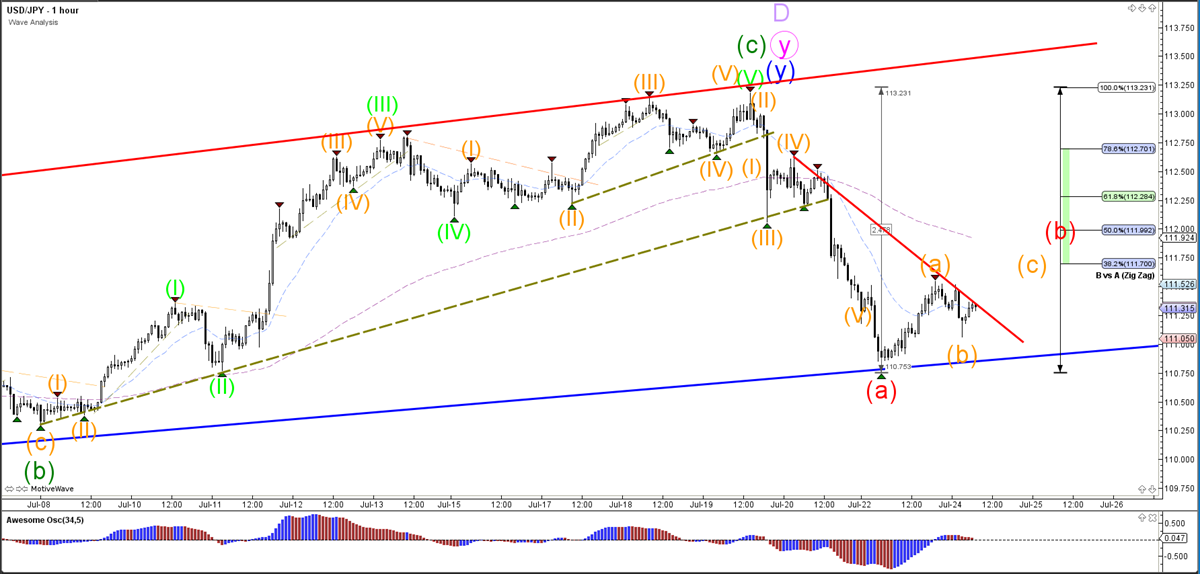
The USD/JPY seems to be building an ABC pattern (orange) within wave B (red). A bullish breakout could indicate above the resistance trend line (red) could indicate a larger bullish wave C (orange) pattern in wave B (red).



Comments
Log in or sign up to join the conversation.