
USD/JPY
4 hour
(Click on image to enlarge)

The USD/JPY uptrend channel reached the 110 round level and 38.2% Fibonacci level of potential wave D (light purple) and price seems to be moving away from this target. The direction of the USD/JPY however will depend on how price will respond to the channel. A bearish break below the channel could indicate the completion of wave X (pink) and the start of a bearish correction whereas a bullish break could see price move towards the 50% Fib.
1 hour
(Click on image to enlarge)
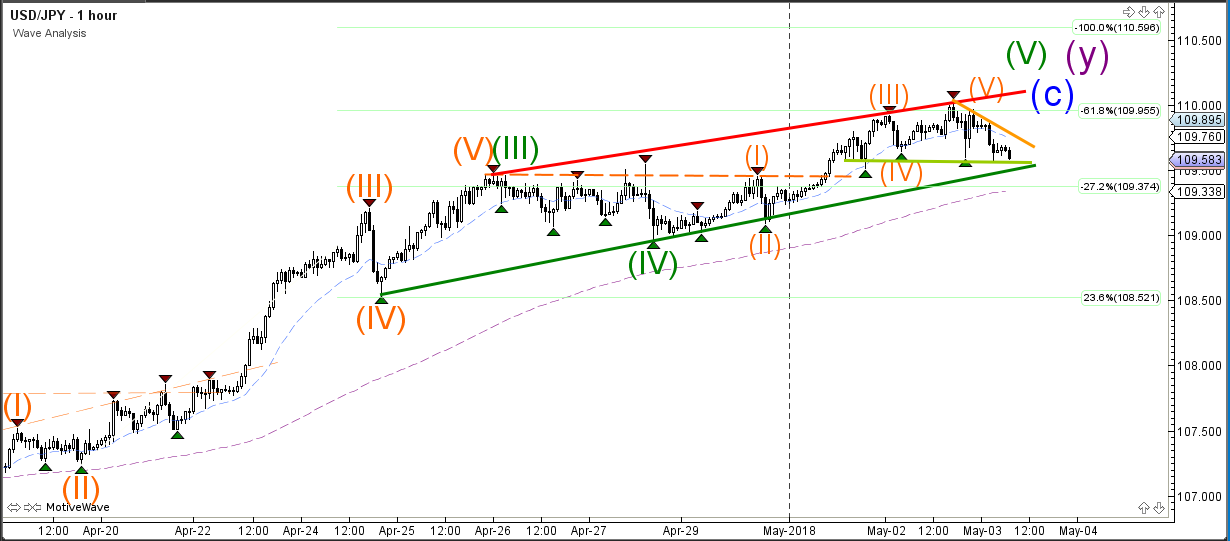
The USD/JPY could see a continuation of the wave 5 (green) if price stays above the support trend lines. A break below the support zone could indicate the completion of the bullish pattern.


Comments
Log in or sign up to join the conversation.