

USDCAD is trading inside a descending channel with its lower highs and lower lows since June. Price is now testing the channel bottom around 1.4154, which could open the path for a steeper decline or a near-term correction.
If this floor gives way, USDCAD could see an extension of losses below the channel, but a bounce off current levels could set up a corrective move back toward the Fibonacci retracement zone, where sellers may be waiting to reload short positions.
The 38.2% Fib at 1.4186 is the first potential ceiling, followed by the 50% level at 1.4196 and the 61.8% level at 1.4206, which also converges with the underlying descending trend line and could be the line in the sand for a bearish correction.
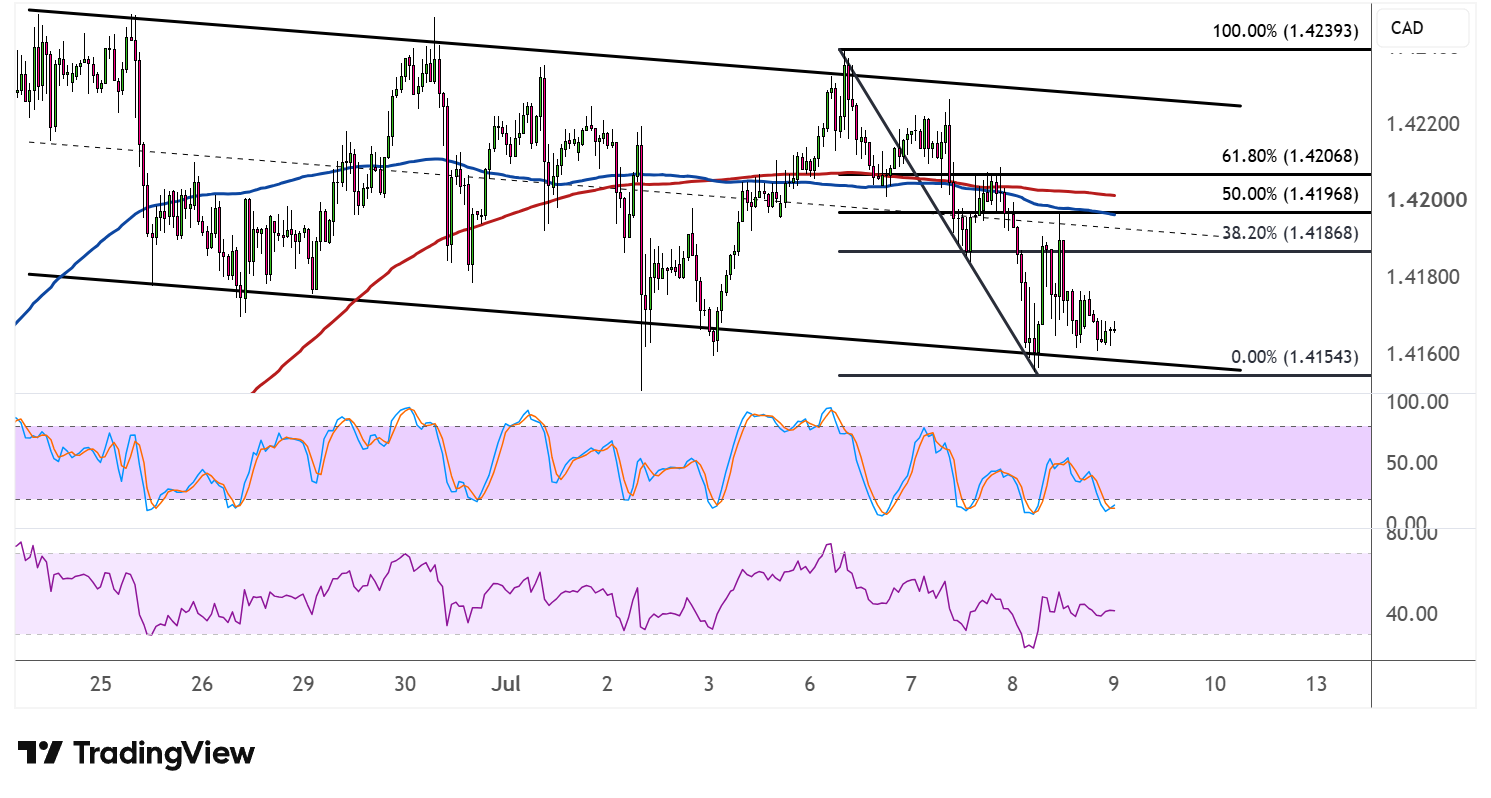
The 100 SMA has crossed below the 200 SMA, confirming that the path of least resistance is to the downside or that the recent slide is more likely to continue than reverse. The gap between the two moving averages is widening, reflecting strengthening bearish momentum.
Stochastic is hovering in the oversold area, suggesting sellers may be due for a breather, which could allow a corrective bounce to unfold. RSI, meanwhile, still has room to fall before reaching oversold territory, so price could keep drifting lower if buyers fail to step in convincingly.
If any of the Fib levels or the descending trend line hold as resistance, USDCAD could resume its slide toward the channel bottom or lower, potentially testing fresh lows below 1.4154. A stronger recovery back above the 61.8% Fib and trend line, however, could shift the near-term bias back in favor of buyers.
USDCAD may take cues from upcoming Canadian employment data and broader US dollar sentiment tied to Fed policy expectations, both of which could determine whether the current test of support holds or breaks down further.



Comments
Log in or sign up to join the conversation.