

USDCAD has recently moved decisively to the downside, with the drop from the 1.3960 highs unfolding in a notably sharp and impulsive manner. This type of price action often signals strong underlying bearish pressure, increasing the probability that the market will eventually attempt a break below the 2026 lows.
However, before any such continuation lower can develop, the pair is currently showing signs of a corrective recovery. This rebound is best interpreted either as wave E within a higher-degree triangle formation or alternatively as a wave two retracement within a broader bearish impulse structure.
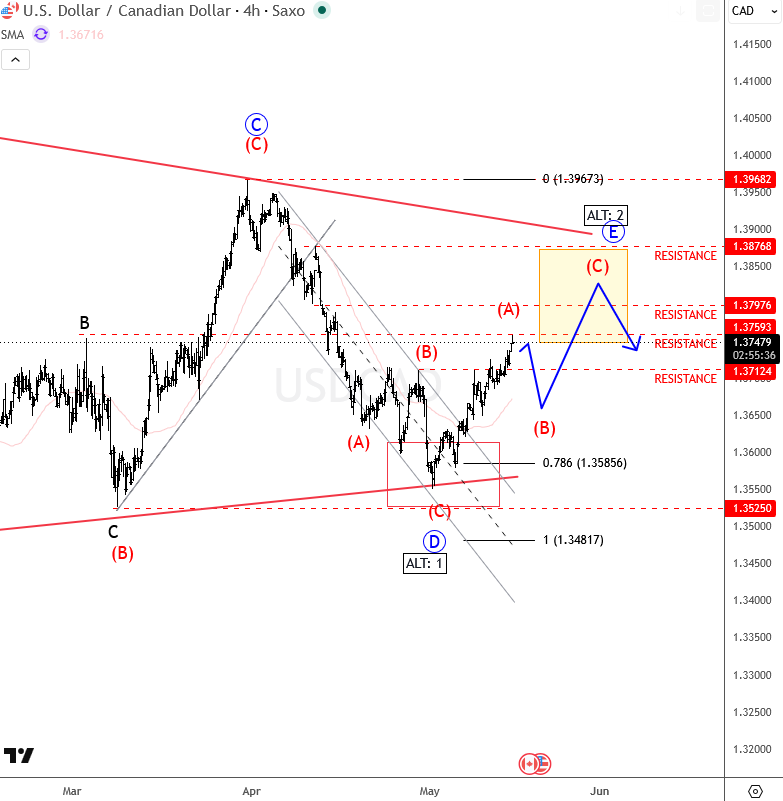
In both interpretations, the ongoing move higher is expected to unfold in a three-wave A-B-C corrective structure. This suggests that while further upside is still possible, the rally should remain corrective in nature rather than impulsive. Within this framework, a temporary setback in wave B would be normal before a final push in wave C completes the correction.
From a technical perspective, the key resistance zone is located between 1.3850 and 1.3900. This area is expected to act as a significant barrier where bullish momentum may start to fade.
Once a complete A-B-C corrective structure is confirmed, attention should shift back to the downside. The ideal region to look for renewed bearish positioning lies between 1.3760 and 1.3870, where resistance confluence aligns with prior structure and potential wave completion.
Overall, while short-term recovery is in play, the broader bias remains bearish as long as price action fails to establish a sustained break above the 1.3900 region.


Comments
Log in or sign up to join the conversation.