


The USD/CAD pair reverses an intraday dip to sub-1.3800 levels and fills a modest weekly bearish gap, hitting a fresh daily top during the first half of the European session on Monday. Spot prices currently trade around the 1.3815 region, close to the highest since April 13, touched on Friday, though bulls seem hesitant amid a combination of diverging forces.
Crude Oil prices plummet to over a two-week high amid renewed hopes for a US-Iran peace deal and reopening of the Strait of Hormuz, undermining the commodity-linked Loonie and supporting the USD/CAD pair. Meanwhile, the latest optimism exerts heavy downward pressure on the safe-haven US Dollar (USD) and might keep a lid on any meaningful upside, warranting some caution before positioning for an extension of a three-week-old uptrend.
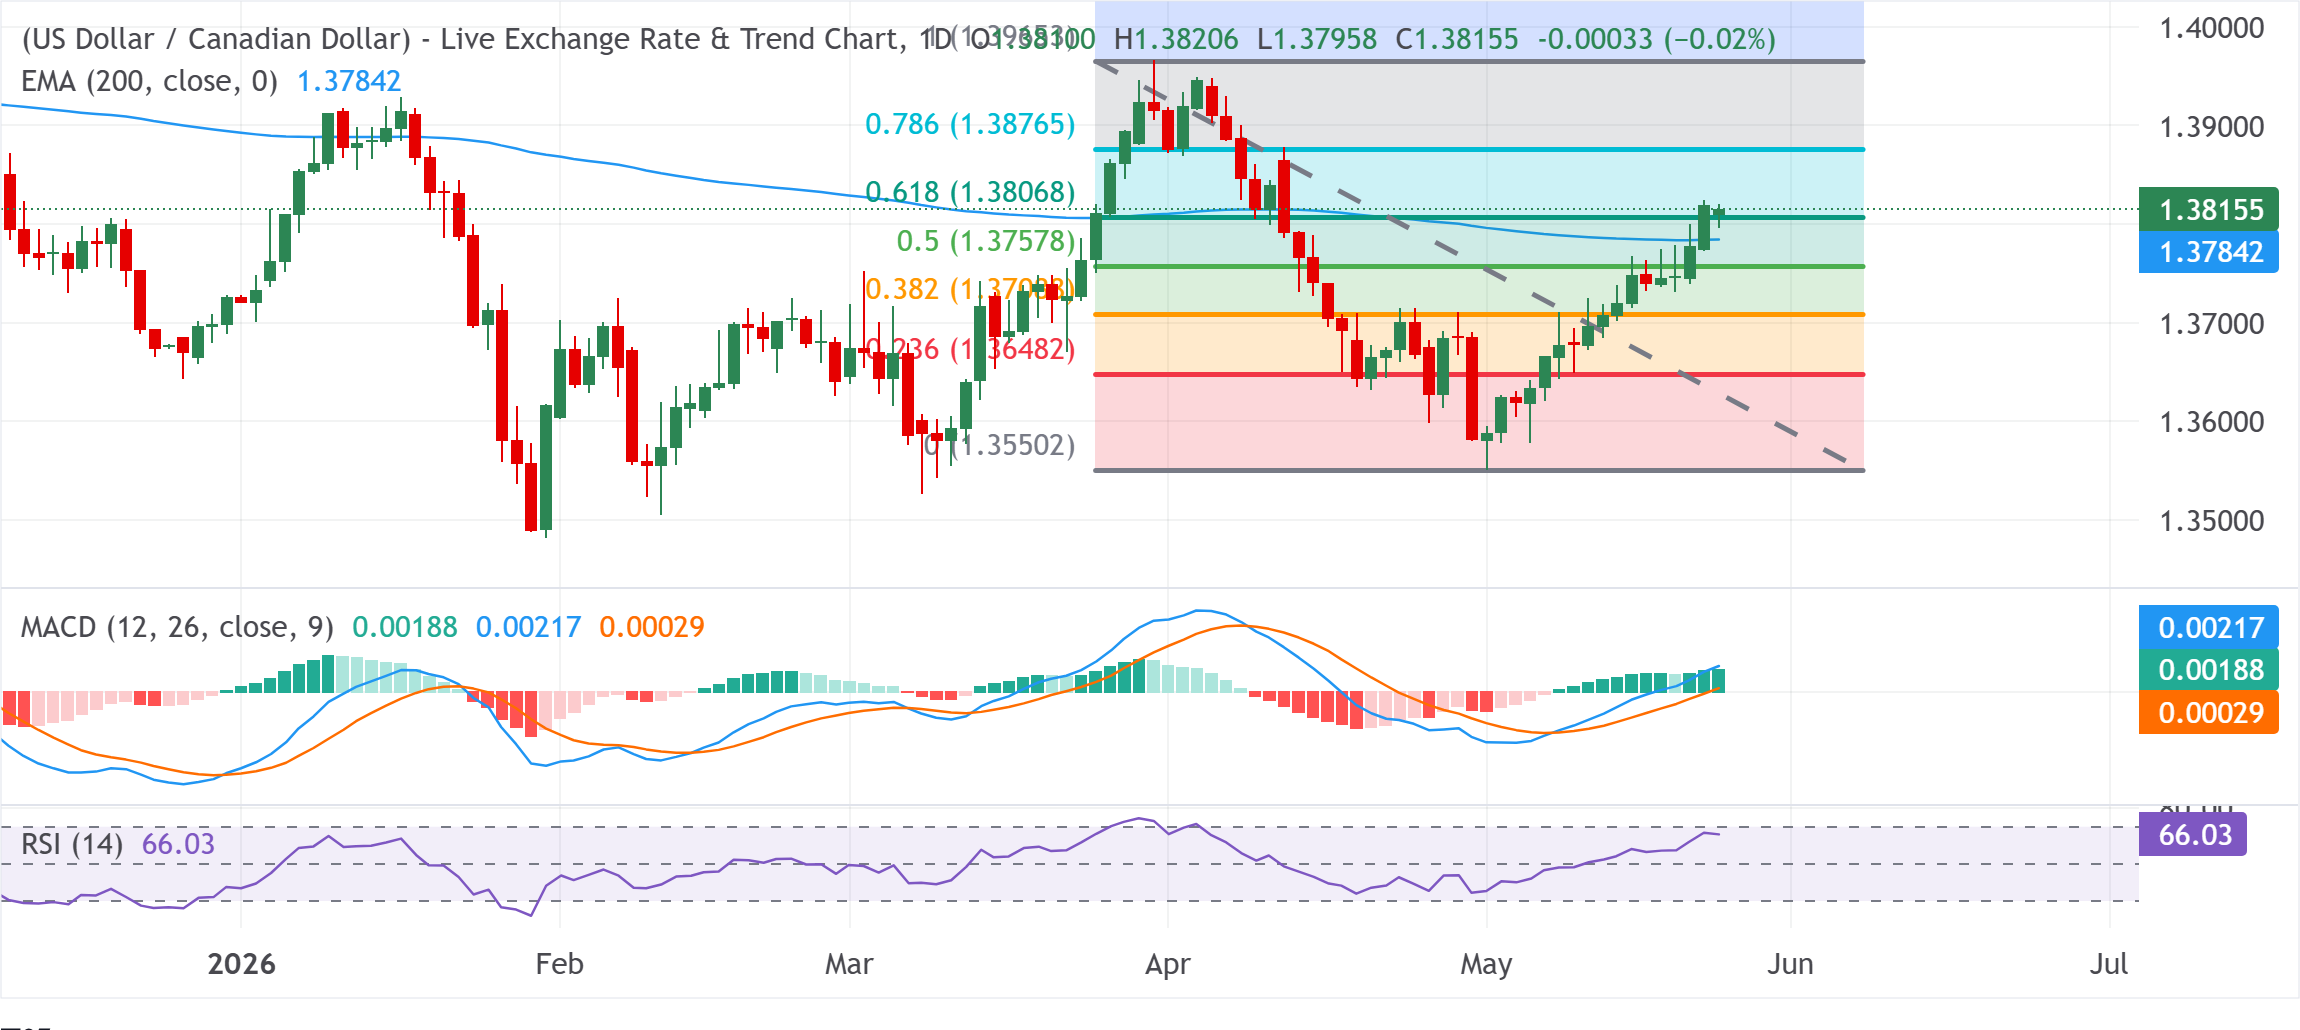
From a technical perspective, the USD/CAD pair keeps a constructive bullish bias above the 200-day Exponential Moving Average (EMA) and the 61.8% Fibonacci retracement of the March-May decline. Adding to this, a positive, rising Moving Average Convergence Divergence (MACD) histogram hints that upside momentum is strengthening. However, the Relative Strength Index (RSI) is approaching mildly overbought territory, holding back bulls from placing aggressive bets.
Hence, any subsequent move up is likely to confront immediate resistance at the 78.6% Fibo. retracement at 1.3877, with the recent swing high near 1.3965 as a stronger cap if buyers extend the move. On the downside, initial support sits in the 1.3807–1.3784 area, where the 61.8% retracement and the 200-day EMA cluster, followed by the 50% retracement around 1.3758, while deeper pullbacks would expose the 38.2% level at 1.3709 and the 23.6% retracement at 1.3648.
(The technical analysis of this story was written with the help of an AI tool.)
USD/CAD daily chart


Comments
Log in or sign up to join the conversation.