


Source: Admiral Markets MT5 with MT5SE Add-on
After the strong breakout of W H4 level, the USD/CAD has had a powerful upside momentum reaching both W H5 and new D H3 resistance. This is a resistance cluster now, and any sign of a bearish divergence or a reversal pattern could reject the price. Watch for the 1.3138-48 zone and a possible 1.3060 retest. However, if we don't see any rejection from the zone, the pair could go up further towards 1.3192. A strong close above 1.3192 should target 1.3266. However, W H5 is the strongest weekly resistance so there should be resistance there.
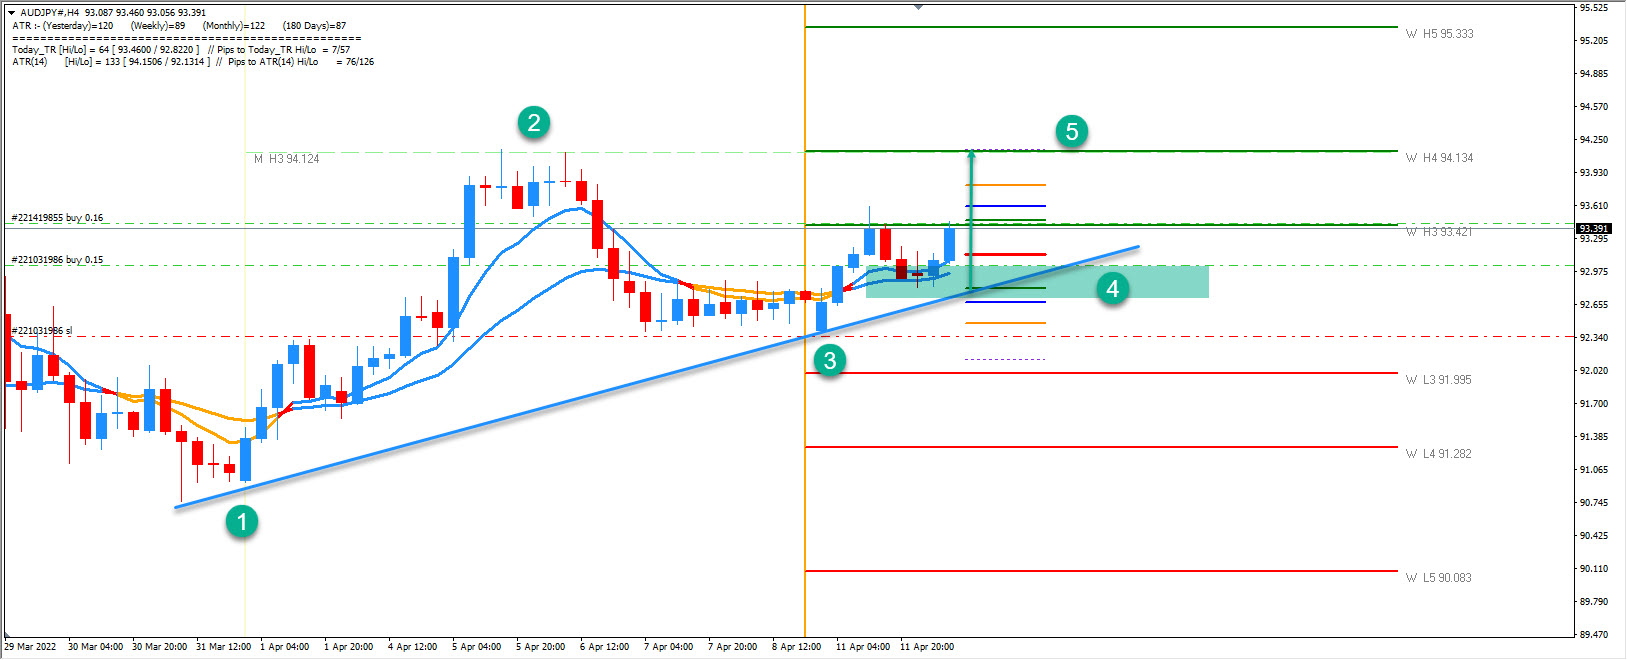
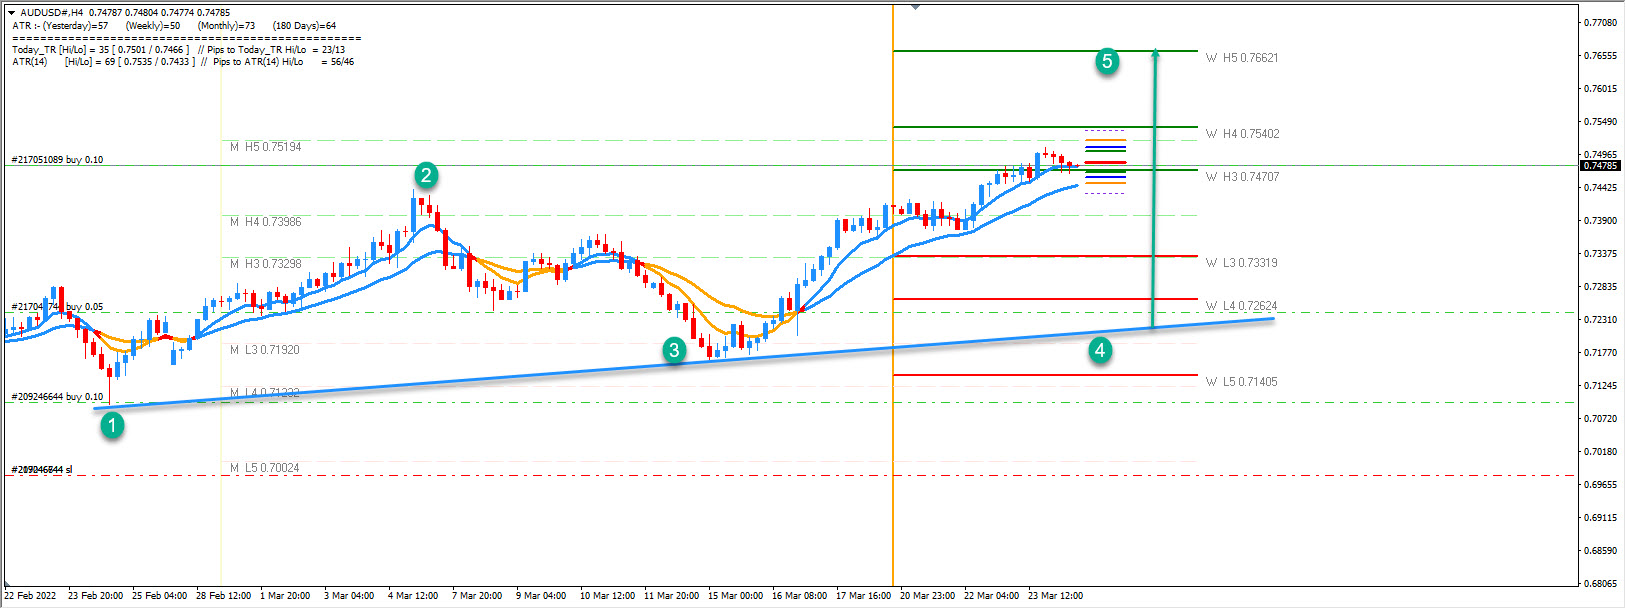
W L3 - Weekly Camarilla Pivot (Weekly Interim Support)
W H3 - Weekly Camarilla Pivot (Weekly Interim Resistance)
W H4 - Weekly Camarilla Pivot (Strong Weekly Resistance)
D H4 - Daily Camarilla Pivot (Very Strong Daily Resistance)
D L3 – Daily Camarilla Pivot (Daily Support)
D L4 – Daily H4 Camarilla (Very Strong Daily Support)
POC - Point Of Confluence (The zone where we expect price to react aka entry zone)

Comments
Log in or sign up to join the conversation.