

*** USD/CAD – SHORT TERM ELLIOTT WAVE ANALYSIS ***
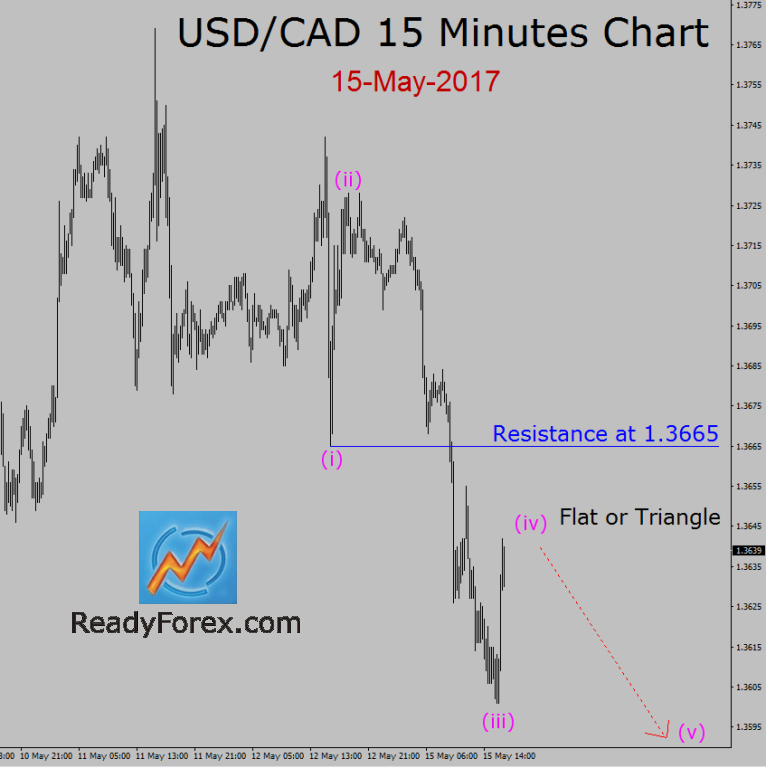
Trend is bearish in USD/CAD currency pair, 15 minutes time frame. As I have suggested few hours ago during my daily Live trading room session, the market is falling down on a short term basis after completing a bullish wave (ii) corrective Elliott wave pattern and traders should look for a short trade. Strong key resistance level is present at 1.3665 price level.
In my judgment, price action in USD/CAD currency pair is now going to move sideways. I expect a bearish Flat or Triangle Elliott wave pattern at wave (iv) location, in the coming trading hours.
Currently; price action is in the process to complete the wave (iv) correction as the pattern looks in-complete. So, wait for the market to first complete the sideways pull back at wave (iv). Next, look for a possible sell trading chance to join the down trend. However; if the price of USD/CAD currency pair breaks above 1.3665 critical resistance level then I might like to stay out of the market and re-examine the fifteen minutes chart of USD/CAD currency pair.
Comments
Log in or sign up to join the conversation.