
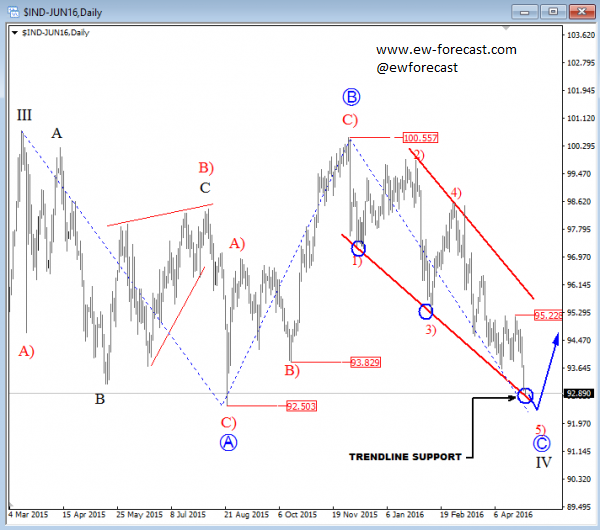
On USD index daily chart we are observing a big sideways, slow and overlapping price action which is a personality of a contra-trend movement. We are observing a flat pattern in black wave IV. It's a three wave pattern where final subwave, wave C should be made by five waves. Well, we can see nice decline from end of 2015 that can be in five legs, but as an ending diagonal. That's a reversal pattern which may send price into a strong bullish mode in the second part of this year, after price recovers back above 95.22.
USD Index, Daily


Comments
Log in or sign up to join the conversation.