

A recurring theme that continues to garner attention among investors has been the seemingly relentless flattening of the U.S. Treasury (UST) yield curve. Indeed, it is a topic I have addressed multiple times over the last few months, but given its ongoing importance among market participants—as well as the financial media—I feel it is necessary to provide updates on both current developments and our insights on the matter.
Without a doubt, the flattening of the yield curve has been the overarching theme year-to-date. However, it was the more recent bout of narrowing between the UST 2-Year yield and the UST 10-Year yield that has more than piqued investors’ curiosity. To provide some perspective, from their post-election peak yield levels in December, the UST 2-Year/10-Year spread has narrowed by nearly 75 basis points (bps) to +59 bps. It should be noted, however, that this differential was as wide as +86 bps in early October and has since tightened by just under 30 bps as of this writing. This represents almost 40% of the overall flattening of the yield curve in just under a two-month period.
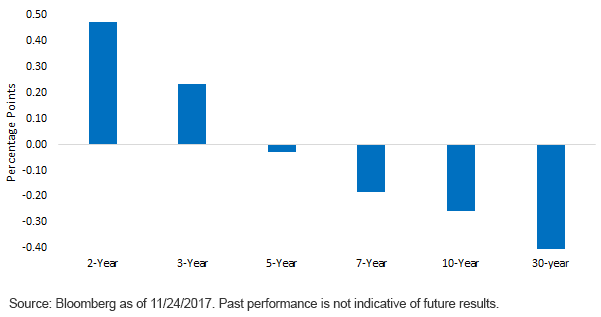
Change in UST Yields from Dec 2016 Peak
(Click on image to enlarge)
Heading into 2017, there were calls for a flattening to occur, but the expectation centered more around all yield levels rising, and that shorter-dated rates would increase more than any hike in longer-dated maturities (bear flattener). So, while the narrowing call has thus far proven to be accurate, how we got here has been the bigger surprise. To be sure, the 2017 flattening phenomenon has been a clear-cut case of rates along the yield curve moving in opposite directions.
Let’s take a closer look at how UST yields along the curve have behaved since their post-election highs. The table highlights the fact that the flattening was due to an increase of nearly 50 bps in 2-Year yields being juxtaposed against a roughly 25-bp drop in the 10-Year yield. The 5-Year sector has essentially been the fulcrum of this seesaw pattern, with maturities less than five years registering rate increases and those greater than five years seeing declines in yield levels. For the record, the UST 5-Year yield has basically remained unchanged.
Conclusion
So, where do we go from here? The most likely result appears to be a continued flattening into 2018, especially if the Federal Reserve (Fed) follows through on its rate hike forecasts (one more this year and three next year). Given the sensitivity to developments in the Federal Funds Rate, one could argue that it would only take two additional Fed moves to push the UST 2-Year yield to within less than 10 bps of the UST 10-Year yield, assuming, of course, that the latter maturity stays relatively constant. Even if the 10-Year yield remains range-bound, but at the upper end of the band around the 2.60% level (a roughly 30-bp increase from current levels), the curve should still flatten if the Fed does go ahead with two, three or even the four rate hikes that were projected back at the September FOMC meeting. What about an inverted curve (2-Year yield > 10-Year yield), you may ask? It may all come down to the Fed. If four rate hikes occur between now and year-end 2018, the odds of such a development rise, given our aforementioned “top of the range” scenario for the 10-Year yield. Certainly, any corresponding decline in the 10-Year yield would push the curve into inverted territory for the first time since 2007.



Comments
Log in or sign up to join the conversation.