

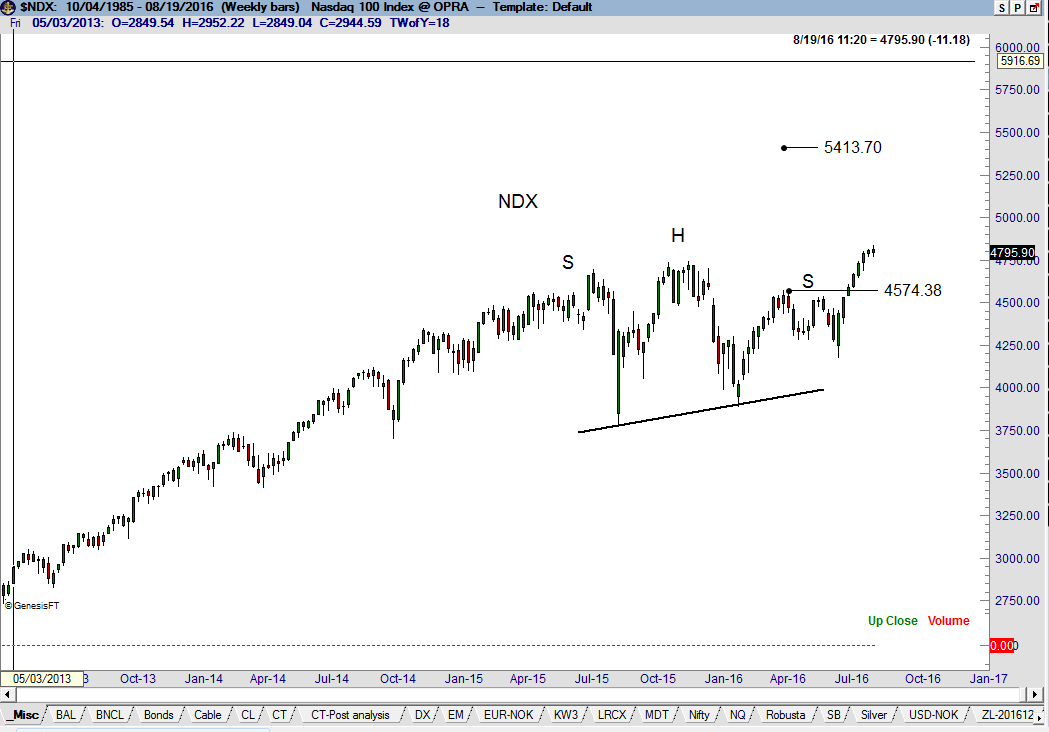
U.S. stocks remain in strong underlying bull trends. The dominant pattern in the Nasdaq is a completed 18-month H&S failure pattern with a target of 5413.
(Click on image to enlarge)
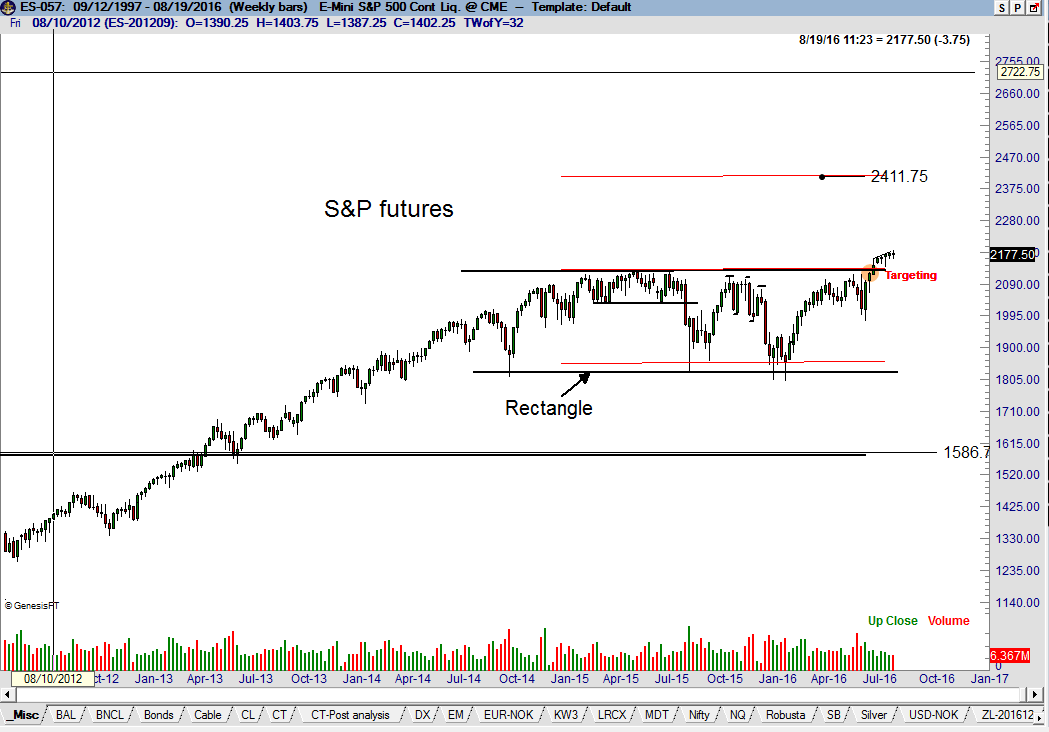
The S&P weekly chart displays a completed 2-year rectangle with a possible target of 2411.
(Click on image to enlarge)
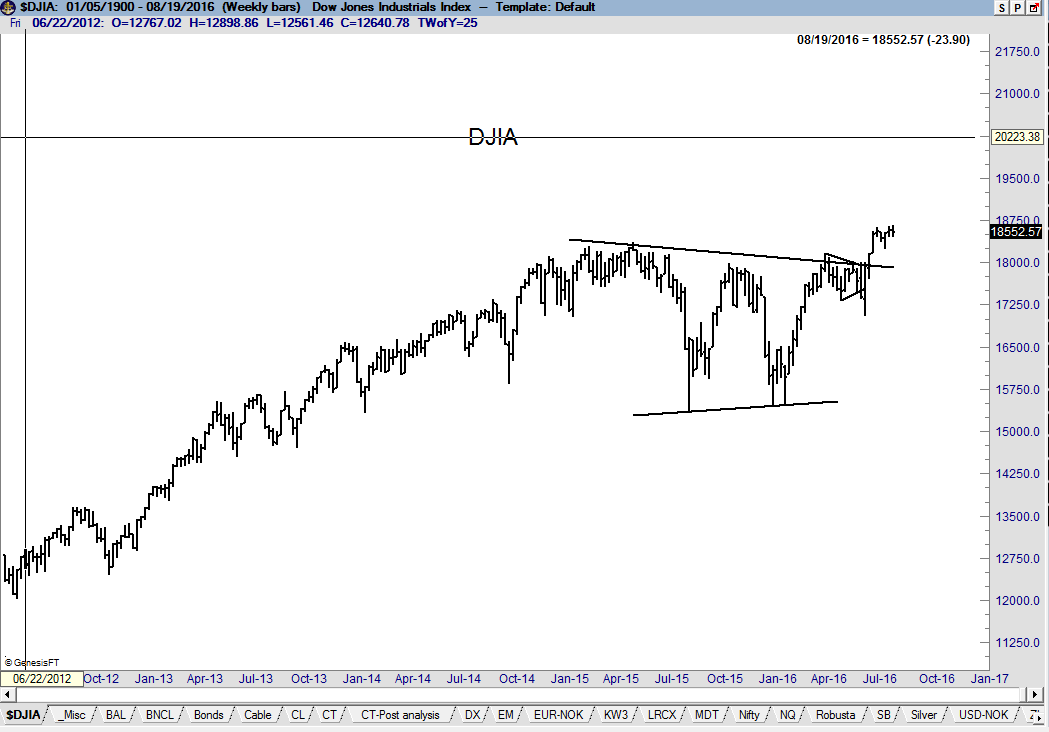
I realize that these U.S. Stocks targets seem impossible for some very smart global macro traders in the Factor community. I highly respect a number of you who are extremely negative on the U.S. stock market based on your research. You may be right – I can only communicate what the charts are telling me right now. Factor is long Nasdaq futures.
(Click on image to enlarge)


Comments
Log in or sign up to join the conversation.