

If there is one thing you can say about markets, it is that they keep you on your toes. If you were sitting with a long position in GBP or USD toward the end of 2017, you had reason to hope that there would be more money in your pocket by mid-2017 than if you were short. However, the wheels of fortune turn, and we can see that clearly through a persistently weak USD and GBP that has become a mainstay in 2017 though for different reasons.
For the USD, we see an apparent mispricing of a previously hawkish Fed getting repriced by the market as the Fed appears reluctant to admit their rate hike forecast was likely too optimistic, which has brought the USD lower through the year. The Fed’s overconfidence in both the resumption of inflation and the political capital of the new administration (though they did not particularly voice their confidence) that would bring about the necessity of tighter policy has so far failed to materialize. Before this belief was discredited, the USD rightly ended 2016 on a high note.
In Britain, there was a view that the dire prediction for the UK economy, and thus, Sterling were overdramatic after the Brexit vote was confirmed. It was believed that adaptive monetary policy and a strong consumer would offset any of the negative effects a Brexit with its renegotiated trade contracts with EU would bring.
Fast forward to today, and both of those views are highly in doubt as evidence mounts to the contrary.
For the US, we continue to see data pointing to lower inflation for longer. Yesterday, we mentioned that most of the upside in commodities, specifically base metals appeared tied to positioning and supply restrictions as opposed to demand.
Another sign that is worth watching, though I doubt many do, is the spread between 1-month and 3-month US T-Bills. T-Bills are effectively seen as cash because of the ST nature, and the creditor is the US government. However, the curve has collapsed of late as doubt mount that the US Government could avoid a debt ceiling deadline to address the debt limit. The 1- and 3-month T-Bills spread has fallen to the lowest since February and is nearly above zero at 1.6bp or .00016. The curve tightening shows investors are demanding more for the short-end paper because the risk of holding paper that matures after the uncertain deadline for debt ceiling negotiations is carrying on a risk premium uncommon for US T-Bills. This appears to be weighing on the USD as we trade within the price range of the 2017 extreme day low of 93.16-92.55.
In the UK, there has been a steady trend of the doubt from UK citizens believing their country is heading in the right direction while Parliament appears to have less negotiating authority than they claimed, as the negotiations get underway. This belief was boostedby Thursday’s data in the UK showing Q2 GDP growth has slowed markedly in the first half of the year due in part by weak manufacturing and construction, and that private consumption also slowed further than expected in Q2. UK GDP is near the lowest levels since 2013, which is helping put pressure on GBP/USD, two relatively weak currencies, and helped EUR/GBP close at the highest levels since 2009 this week on diverging monetary policy prospects.
FX Closing Bell Top Chart: GBP/USD breaking below 1.28 opens approach to 200-DMA (1.2651)
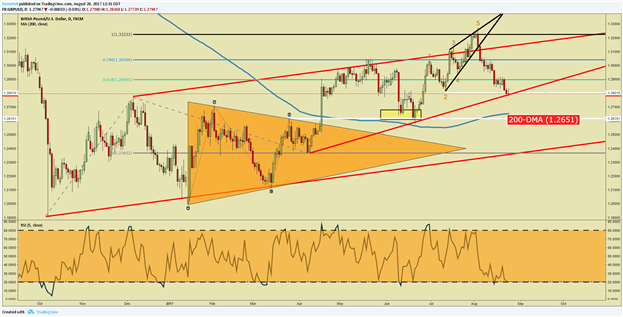
Chart Created by Tyler Yell, CMT
The sentiment highlight section is designed to help you see how DailyFX utilizes the insights derived from IG Client Sentiment, and how client positioning can lead to trade ideas. If you have any questions on this indicator, you are welcome to reach out to the author of this article with questions at [email protected].
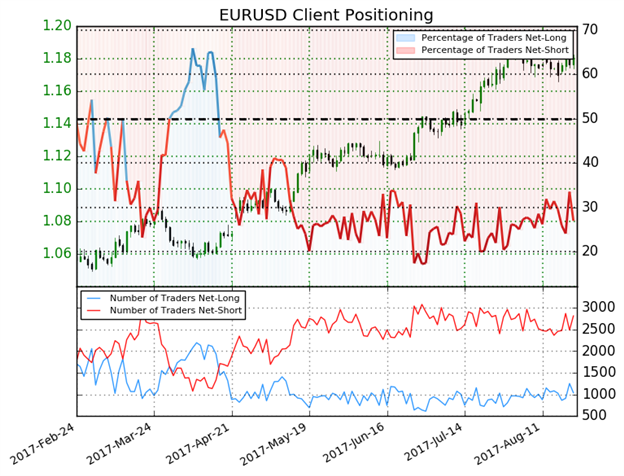
EUR/USD: Retail trader data shows 27.0% of traders are net-long with the ratio of traders short to long at 2.7 to 1. In fact, traders have remained net-short since Apr 18 when EUR/USD traded near 1.07646; price has moved 9.7% higher since then.The number of traders net-long is 19.6% lower than yesterday and 21.5% lower from last week, while the number of traders net-short is 10.8% higher than yesterday and 17.8% higher from last week.
We typically take a contrarian view to crowd sentiment, and the fact traders are net-short suggests EUR/USD prices may continue to rise. Traders are further net-short than yesterday and last week, and the combination of current sentiment and recent changes gives us a stronger EUR/USD-bullish contrarian trading bias (emphasis added).



Comments
Log in or sign up to join the conversation.