

2020 has been the year of historic events gripping the financial markets. None more so than the crash in US oil which traded below zero for the first time in history on 20 April, recording a 321% drop in WTI (West Texas Intermediate) crude oil May futures contract. With the crude oil market officially in panic mode, we discuss how this happened and what could happen next - buckle up and read on!

Contango in the oil market
On 20 April, the price for a barrel of WTI crude oil futures contract expiring in May plunged to -40.32 USD a barrel - a 321% drop. Essentially, this means that producers are paying buyers to take it off their hands as global storage space for oil is full and demand has dried up due to the coronavirus. There has never been a negative price for a futures contract on WTI crude oil.
Some traders were left confused on the day as there are different ways to trade oil which has led to different prices among brokers. It was the WTI crude oil May futures contract that traded in the negative on 20 April. The June futures contract was actually trading between 21 USD and 22 USD at the close of trading on the same day.
This type of situation, while historic, is called contango. This term is used to describe a situation where the future price of a commodity is more expensive than the current spot price. However, the spread between the May and June futures contracts of WTI crude oil was so wide it was deemed a super-contango. This tells us that no one in America wants oil in the short-term.
At Admiral Markets you can trade oil CFDs (Contracts for Difference) on the spot price as well as the futures contracts, for both WTI crude oil and Brent crude oil. If you want to trade CFDs on oil, pay close attention to all the details and all the risks, especially in these highly volatile times.
The crude oil fallout
It was only a few weeks ago that OPEC+ agreed to cut production of oil by 10 million barrels a day. The aim was to cut supply to help stabilise prices. The fact that this hasn't worked has significant consequences for oil companies across the world.
Currently, demand for oil is down by over 20 million barrels a day as the coronavirus affects air travel, manufacturing and nearly all types of industrial sectors. To break even, most oil companies need oil to be trading above $40 per barrel. This means they will be burning through cash and may look to cut dividends and staff to stay afloat.
Last month, shares in oil giants BP and Royal Dutch Shell fell to price levels not seen since the mid-1990s. This is evident in the long-term monthly price chart of BP's share price below.
(Click on image to enlarge)
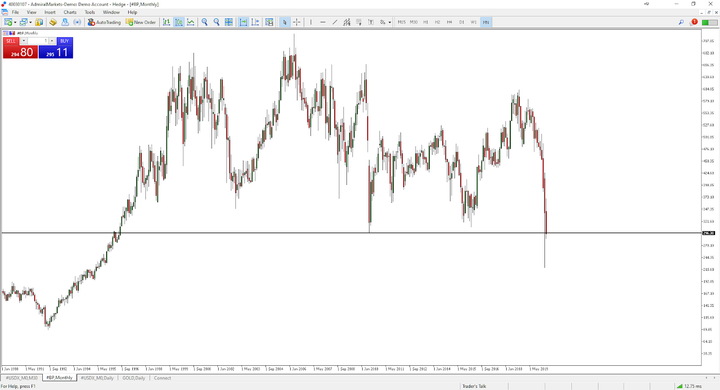
Source: Admiral Markets MetaTrader 5, BP, Monthly - Data range: from 1 January 1990 to 21 April 2020, accessed on 21 April 2020 at 10:05 am BST. Please note: Past performance is not a reliable indicator of future results.
How to trade WTI crude oil
Below is the long-term monthly price chart of WTI (West Texas Intermediate) crude oil (spot price):
(Click on image to enlarge)
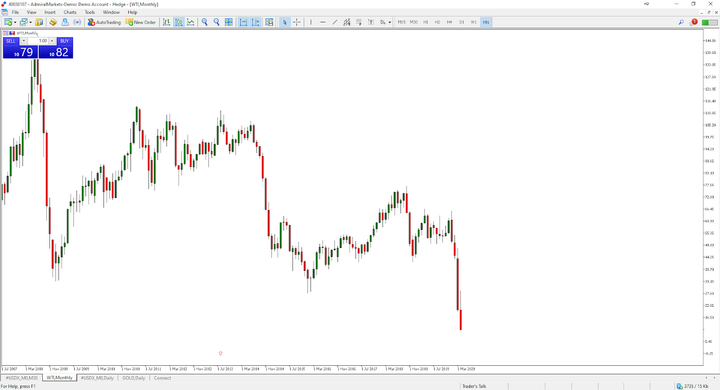
Source: Admiral Markets MetaTrader 5, WTI, Monthly - Data range: from 1 July 2007 to 21 April 2020, accessed on 21 April 2020 at 9:05 am BST. Please note: Past performance is not a reliable indicator of future results.
With Admiral Markets you can speculate on the price direction of WTI crude oil by using a CFD (Contract for Difference) which allows traders to go long and short on the market. The daily chart below also shows an extremely bearish picture with sellers in full control.
(Click on image to enlarge)
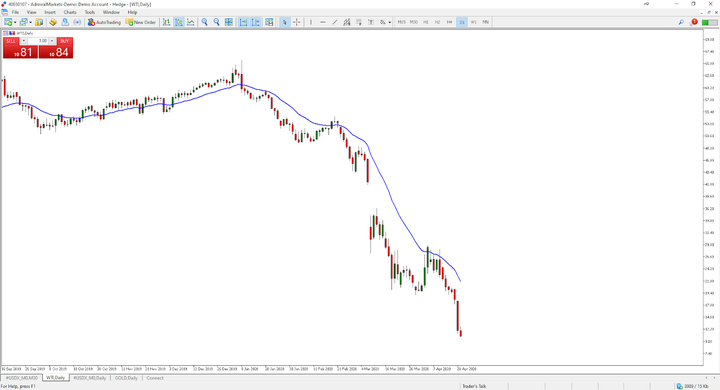
Source: Admiral Markets MetaTrader 5, WTI, Daily - Data range: from 16 September 2019 to 21 April 2020, accessed on 21 April 2020 at 9:35 am BST. Please note: Past performance is not a reliable indicator of future results.
The price of WTI crude oil in the chart above has stayed below its 20-period exponential moving average since the beginning of the year. While the price has tried to break above the moving average it has failed twice, in February and March, confirming just how strong the selling is. The only question is how to trade it?



Comments
Log in or sign up to join the conversation.