

Once again, let's take a look at the latest news in the energy markets.
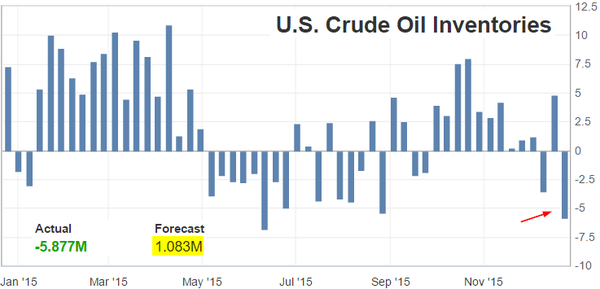
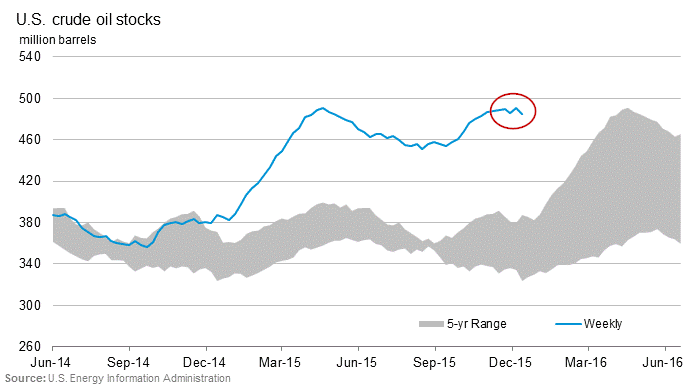
Now the EIA report also shows a large draw on US crude inventories (yesterday we saw the API results). This draw-down was significant and is taking place at the time of the year when inventories normally expand.
Source: Investing.com
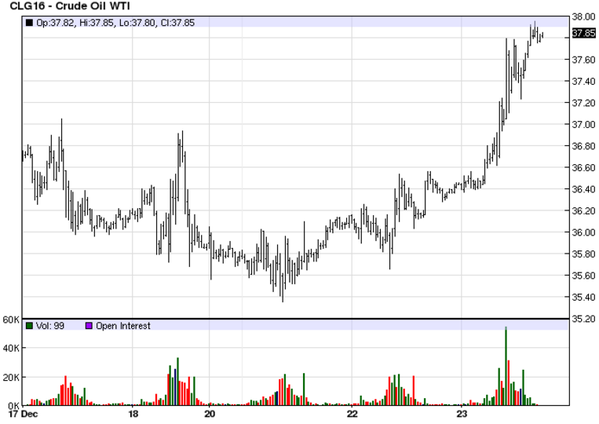
As a result of this inventory draw, we got that crude oil bounce I've been discussing. WTI futures rose by 9% over the past couple of days. The oil short has been a crowded trade.
Source: Barchart.
Moreover, the unexpected drop in US inventories sent Brent-WTI spread (the nearby contract) deeper into negative territory. WTI is now trading well above Brent - something we haven't seen in quite some time. US shale firms now face additional competition from abroad.

Source: @SoberLook, barchart
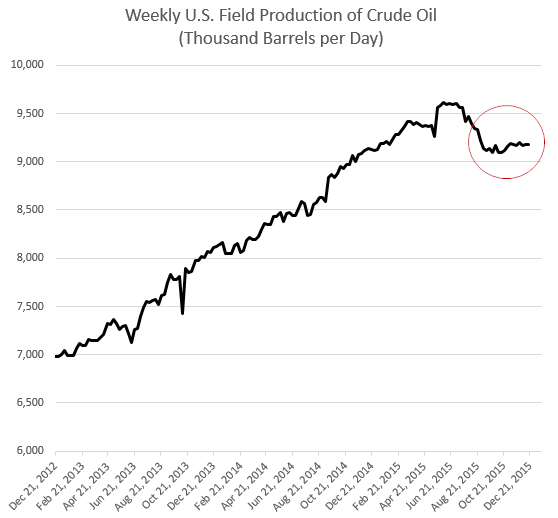
Before celebrating the crude oil rally, it's important to point out that the fundamentals remain terrible for now. For example, according to the EIA, US crude oil production is persistently above last year's level. After the initial drop from the peak, production leveled off - even at these low prices. There is no question production will decline further next year, but the timing remains a big question mark.
Source: @SoberLook, EIA
The rally in crude oil turned on the risk sentiment as oil-sensitive products (such as HY) rallied. Here is the MLP index vs. S&P500.

Source: Ycharts.com
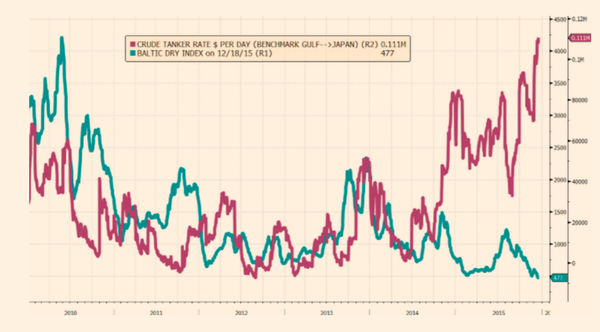
The Baltic Dry Shipping Index has been hitting new lows.

Source: stockcharts.com
But not all shipping is the same. With the crude oil curve remaining steep this year (contango), shipping crude oil has been quite profitable and crude tanker rates spiked.
Source: @acemaxx, @fastFT
Turning to US fixed income markets, we see speculative accounts being quite short treasuries. The net short balances of course are rather different across the curve, but the sentiment is very negative for most maturities. We've seen this before as funds bet against treasuries and got burned. Is it going to be different this time? Perhaps. For now it looks like a crowded short.

Source: Deutsche Bank
When will the Fed finally exit its bloated balance sheet? One way is to look at the pace of draining excess reserves. Here is what the balance sheet looks like over time.

Source: Deutsche Bank
The Fed will not be selling its securities holdings. Therefore there are really only two processes by which reserves will be permanently drained. One is for bank notes in circulation to increase. This is driven by consumer demand for physical cash and the Fed has little direct influence over it. The second is for the Fed to stop rolling maturing securities on its balance sheet. Most expect this to take place in late 2016 at the earliest, and potentially much later. Below are two scenarios for draining reserves from Deutsche Bank (note that while RRP transactions will also reduce reserves, it's not a permanent reduction).

Source: Deutsche Bank
Here are a couple of other helpful charts from Deutsche Bank.
1. Treasury fails (failing to deliver on a short sale) have been rising. Part of the reason is the fact that the Fed's balance sheet is aged and does not have new/on-the-run treasuries. Therefore the Fed's Term Securities Lending Facility (TSLF) doesn't have the inventory that short sellers need to deliver the bonds.

Source: Deutsche Bank
2. As discussed before, the general collateral (GC) repo spread to the RRP rate has been elevated lately. This reflects the increased costs of dealer balance sheets (due to regulatory pressures). It will be interesting to see how high this will spike at year-end.

Source: Deutsche Bank
The market-based inflation expectations in the United States continue to decline across the curve. As a result, real rates are rising, creating tighter monetary conditions.

Source: UBS

Below is a chart showing US velocity of money, including the latest Q3 GDP release. This is due to rapid credit growth (expanding the money supply) and weak nominal GDP. Another way to put it is that we are getting less GDP per dollar of new credit.

What's the probability that US PCE inflation will hit the FOMC's target (2%) in 2016? The answer is - not very high.

Source: @stlouisfed
And what's the probability of deflation in 2016? It's definitely not zero.

Source: @stlouisfed
Speaking of inflation, here is the divergence between Core PCE and Core CPI. At least some of this is due to the differences in measuring healthcare inflation.

Source: @stlouisfed, @SoberLook
US new single-family home sales have stalled.

Source: @SoberLook
It's not that builders have trouble selling new homes. In fact here is the median number of months new homes have been for sale since the completion.

Source: @SoberLook
The low sales figures are simply due to the fact that builders just don't focus on affordable homes.

Source: @SoberLook
The entire Daily Shot, including global markets, can be viewed here.
Happy holidays!


Comments
Log in or sign up to join the conversation.