

GBP/USD's first gain in four sessions came from a weaker Dollar after the Fed's hold, and Chancellor Healey's first Budget had little to do with it. The pair's session low, just above 1.3250 and its lowest since mid-October, came well before the Budget speech. It barely moved while the speech ran and is trading just above 1.3300 after the Fed.
The Office for Budget Responsibility (OBR) puts Chancellor Healey's headroom at £15 billion for 2029-30, down from £24 billion in March, even with new taxes on banks and gambling. The 10-year gilt yield eased anyway, on a Budget with about £14 billion of extra debt interest this year in the OBR's forecast, nearly as much as the headroom. The Pound is down against the Euro on the day, so GBP/USD's gain is the Dollar's fall.
The Fed left its rate at 3.75%-4.00%, and Fed Chair Warsh said tighter credit since September, including dearer borrowing for the technology build-out, shows the Fed's policy is working. The Dollar Index made its low of the session while he took questions, and GBP/USD made its high in the same stretch.
On the calendar
September's core Personal Consumption Expenditures Price Index (PCE) comes out at 12:30 GMT on Thursday, forecast at 3.1% for the year after 3%. The headline rate is forecast at 3.6% after 3.4%, and the third-quarter Employment Cost Index follows on Friday at 12:30 GMT, forecast at 0.8% after 0.9%. They're the first US price and wage figures since the hold, and they bear on whether the Fed hikes in December.
Nothing from the UK is on the calendar before the weekend, so the Bank of England (BoE) decision on November 5 is the next event on the Pound's side. Almost every research house expects it to raise the UK's Bank Rate to 4.00% from 3.75%.
On the charts
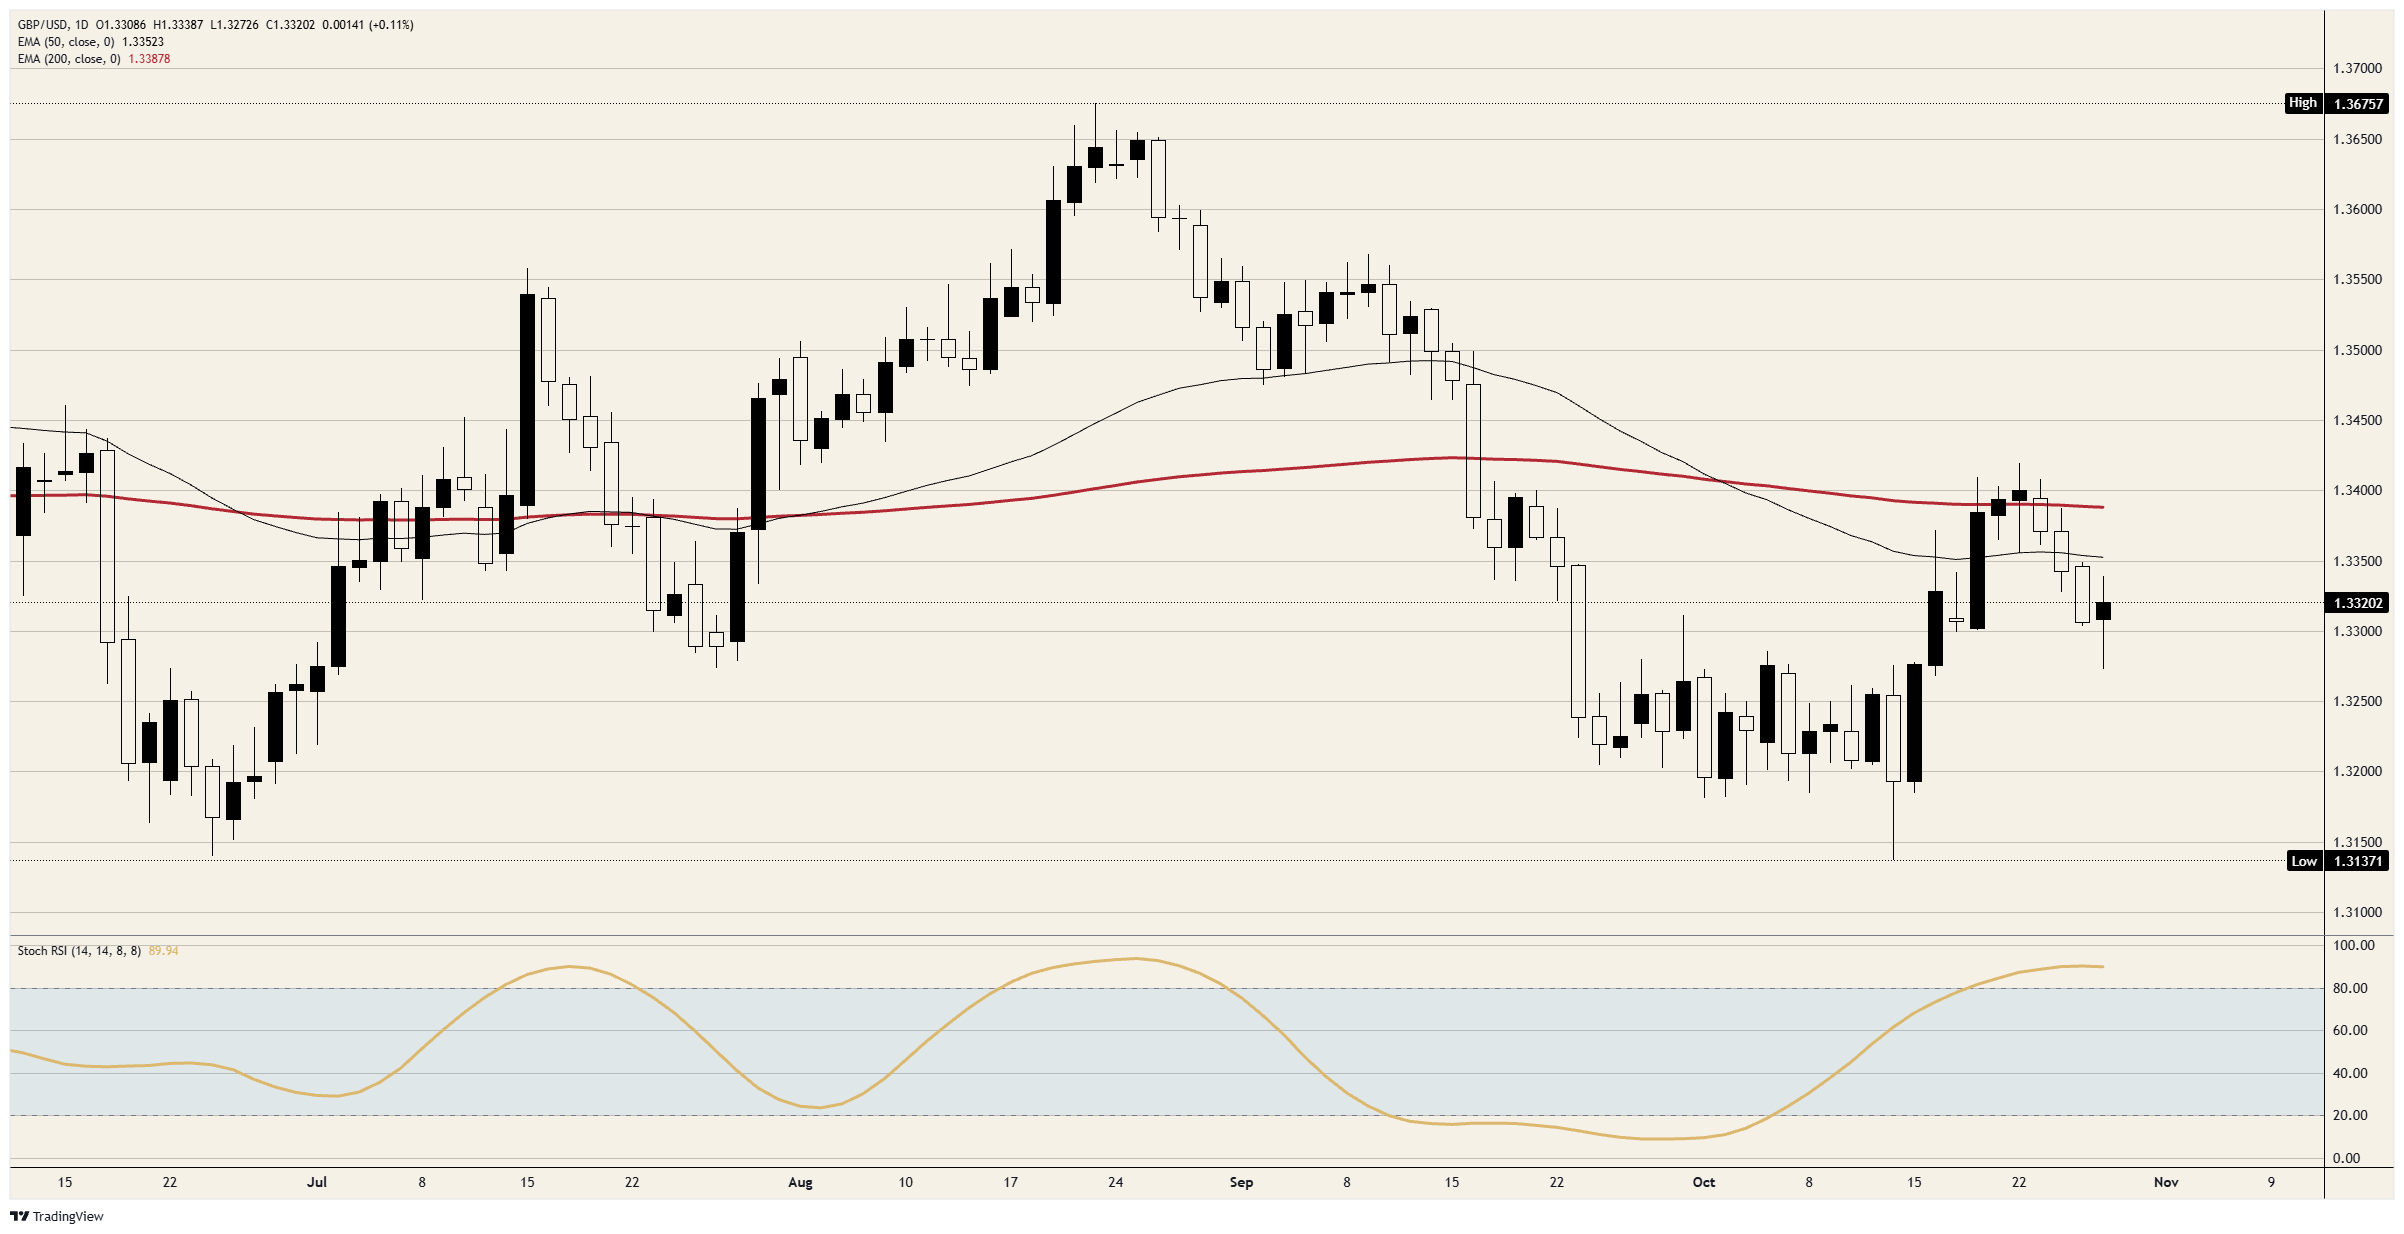
GBP/USD climbed from just under 1.3150 on October 14 to just above 1.3400 on October 22, and the slide into Wednesday's low gave back about half of that climb. The pair is below the 50-day Exponential Moving Average (EMA) near 1.3350 and the 200-day EMA just under 1.3400, which it traded around from October 20 to 22. Daily momentum is still overbought after the three down sessions.
GBP/USD daily chart


Comments
Log in or sign up to join the conversation.