


Last month I closed with “a reminder that the Fed’s interest rate hike and the similar increase in mortgage rates suggest that the recent equilibrium in the market is probably going to be yanked to the downside.” We have already seen that with mortgage applications, which have fallen to close to their 5 year lows. Next in line is sales, and only after that, with a lag, will be prices.
With that in mind, let’s take a look at this morning’s reports on new home sales and median prices, as well as repeat home sales as measured by both the FHFA and Case-Shiller indexes.
Let me start by repeating that new home sales are perhaps the most leading of all the housing sector metrics. But they suffer from being very volatile and heavily revised. So their three month moving average is more reliable as a signal.
In September sales (blue) declined -4,000 annualized to 676,000. But as the graph below shows, this remained close to the high point for this year, and was in the middle of the range for the past 3+ years:
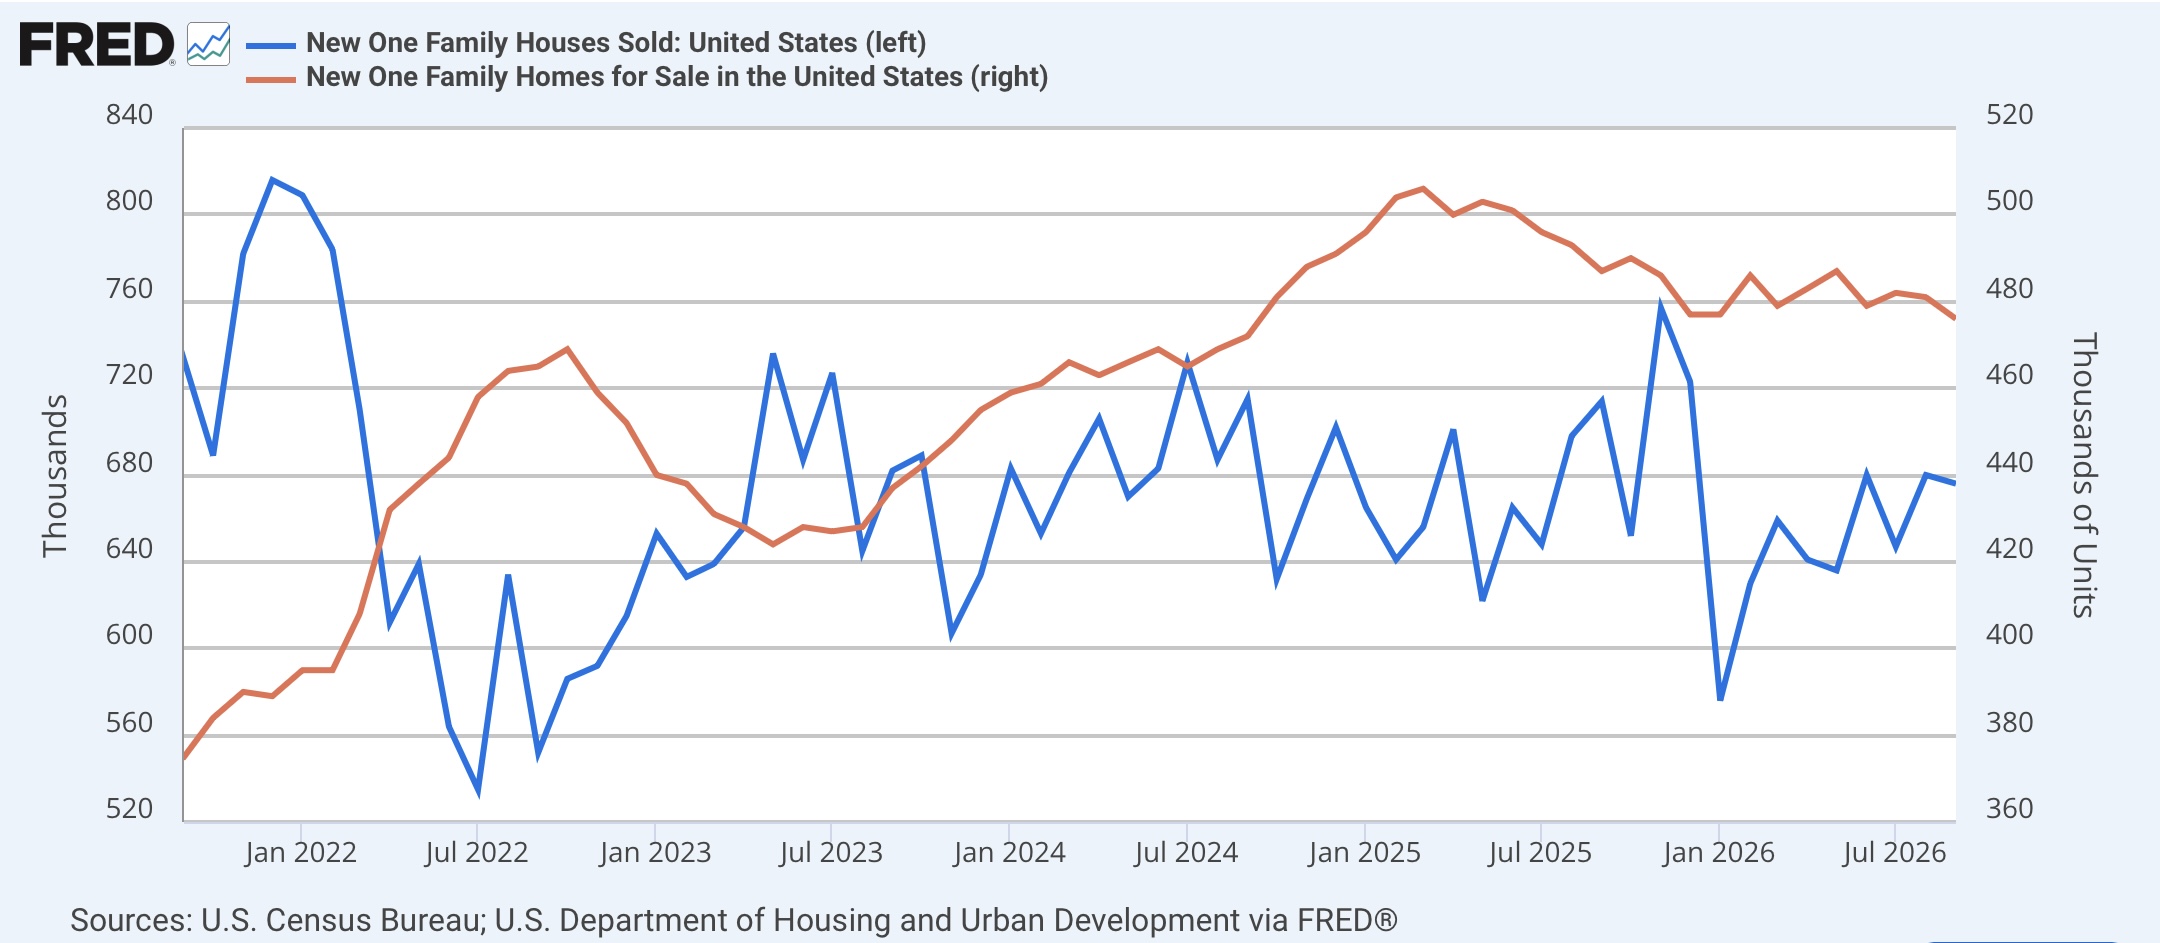
The above graph also shows inventory (red). Although I won’t bother with the historical graph this month, sales have always led inventory, which tends to turn down much closer to a recession, and generally bottoms towards or even after the end of a recession. So the sideways to slightly higher trend this year would normally suggest a recovering housing market.
Prices are not seasonally adjusted, so are best measured YoY. And there, they have been in a sideways to slowly declining trend, which continued in September as the median price for a new home declined -1.0% for the month (dark blue), and -2.3% YoY. The below graph also shows the quarterly averages (light blue), which are down -1.0% YoY:
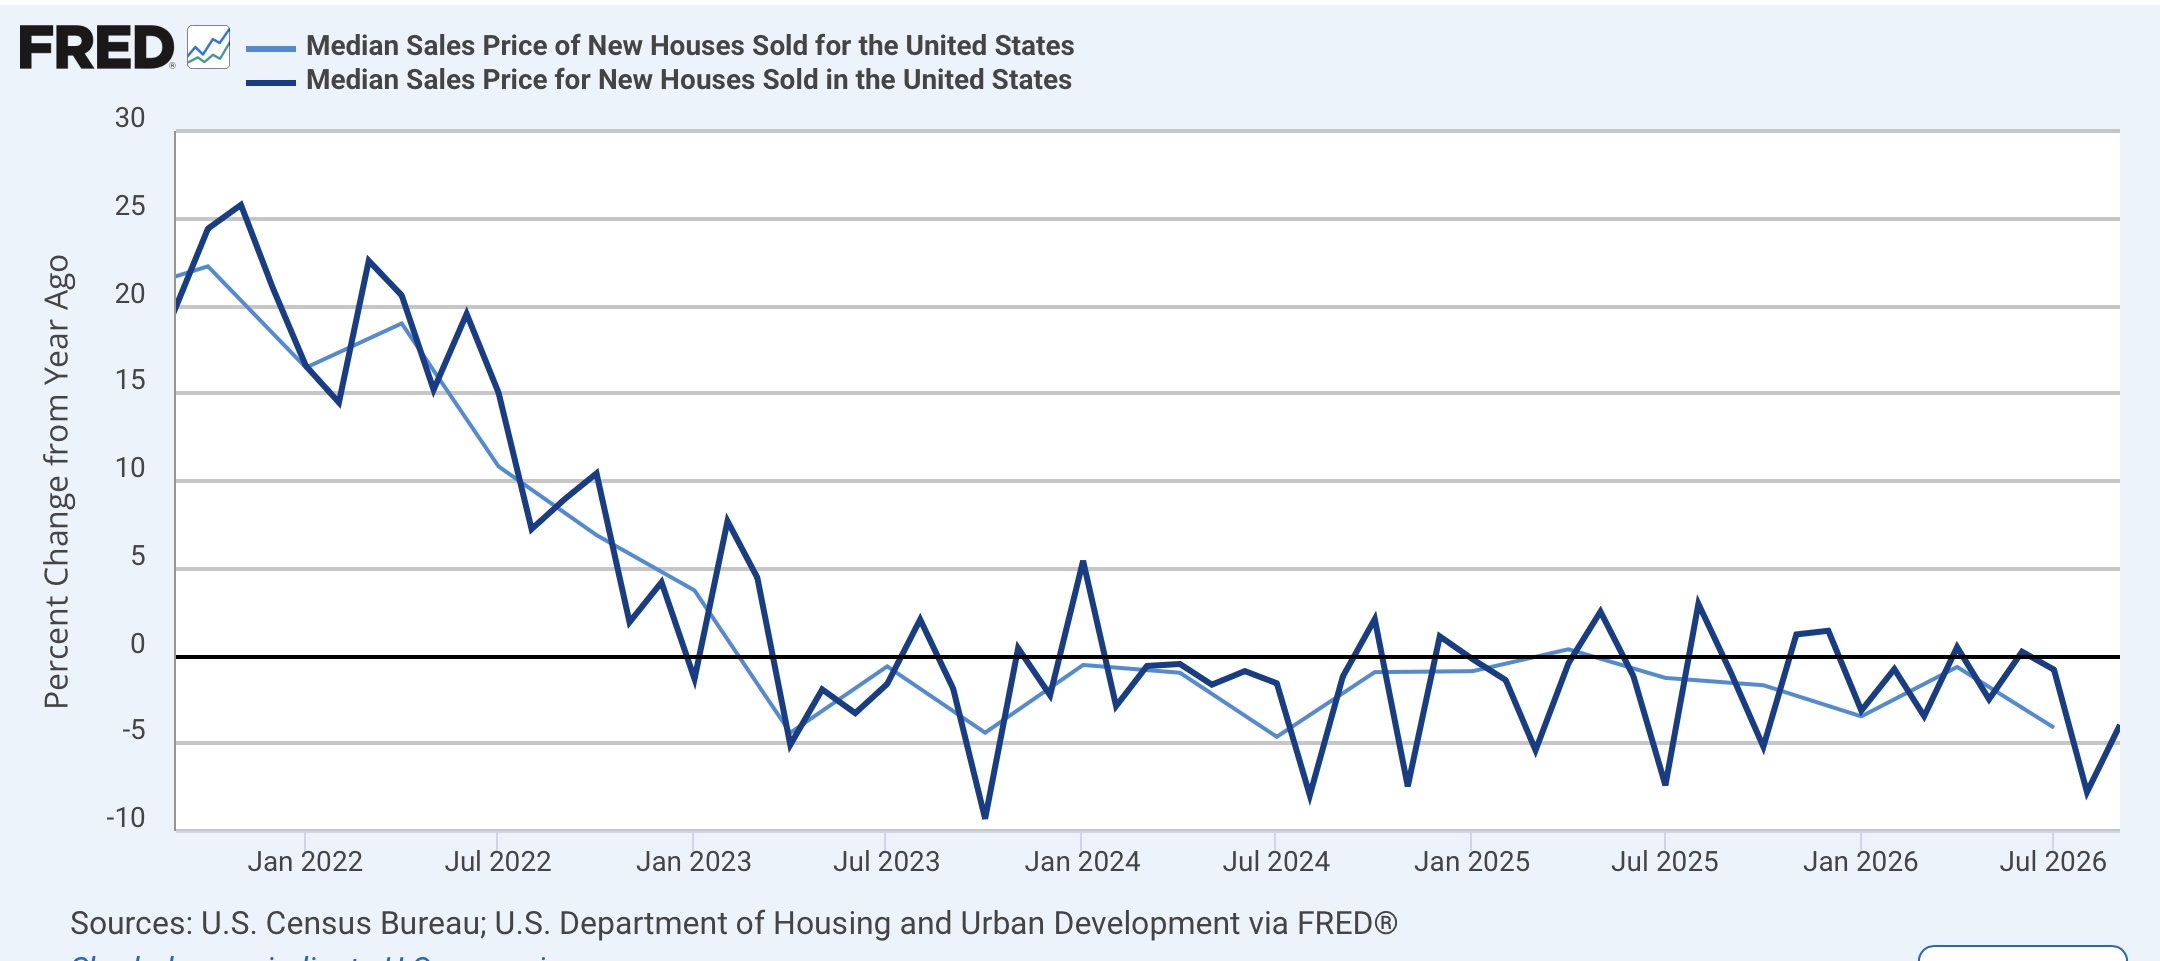
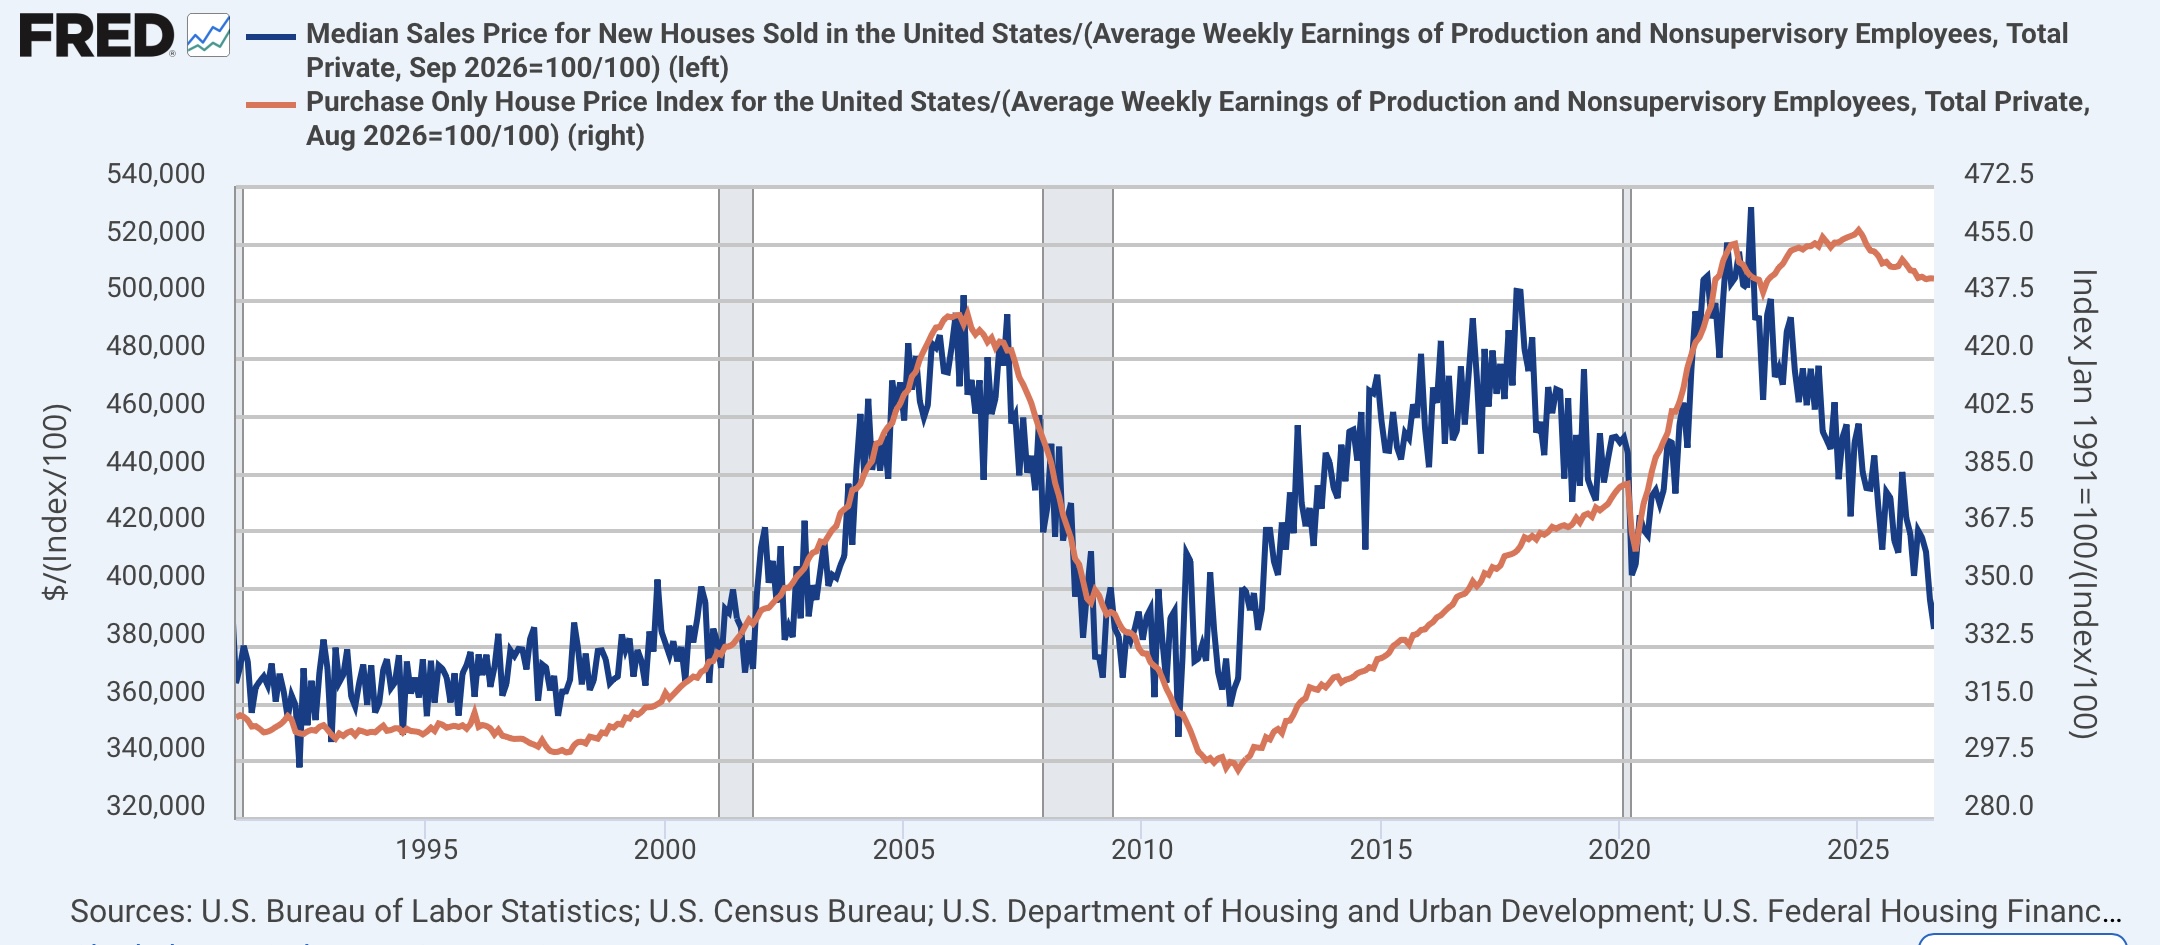
The trend in absolute numbers indicates a general decline in the past four years. Even more importantly, as shown in the graph below, which deflates the median price of a new home by average weekly earnings, normed to 1 as of September, indicates that the “real” median price of a new home (dark blue) is down to its range in the 1990s and after the housing bust around the Great Recession. This contrasts with the “real” similarly deflated cost of existing homes as measured by the FHFA repeat sales index (orange), which while lower than several years ago, is still very high in historical terms:
Before I sum up, let’s turn to this morning’s other housing reports. Although they are not an infallible indicator (nothing ever is!),house prices are an important component of the economy, particularly as they affect the official CPI measure downstream, not to mention their importance to especially younger people in terms of the affordability of purchasing a new or existing home. And the repeat home sales indexes, by S&P Case Shiller and the FHFA, are the best indicator of prices in the 90% of the market that is existing home sales. same.
Since the beginning of this year, prices in both indexes have appeared to be firming, with the FHFA (red in the graphs below) as it often does slightly leading the Case-Shiller National Index (blue). That continued to be the case in this morning’s reports through August, with both reports indicating a seasonally adjusted monthly increase of 0.3% in prices. [Note: FRED has not yet updated the Case Shiller data]:
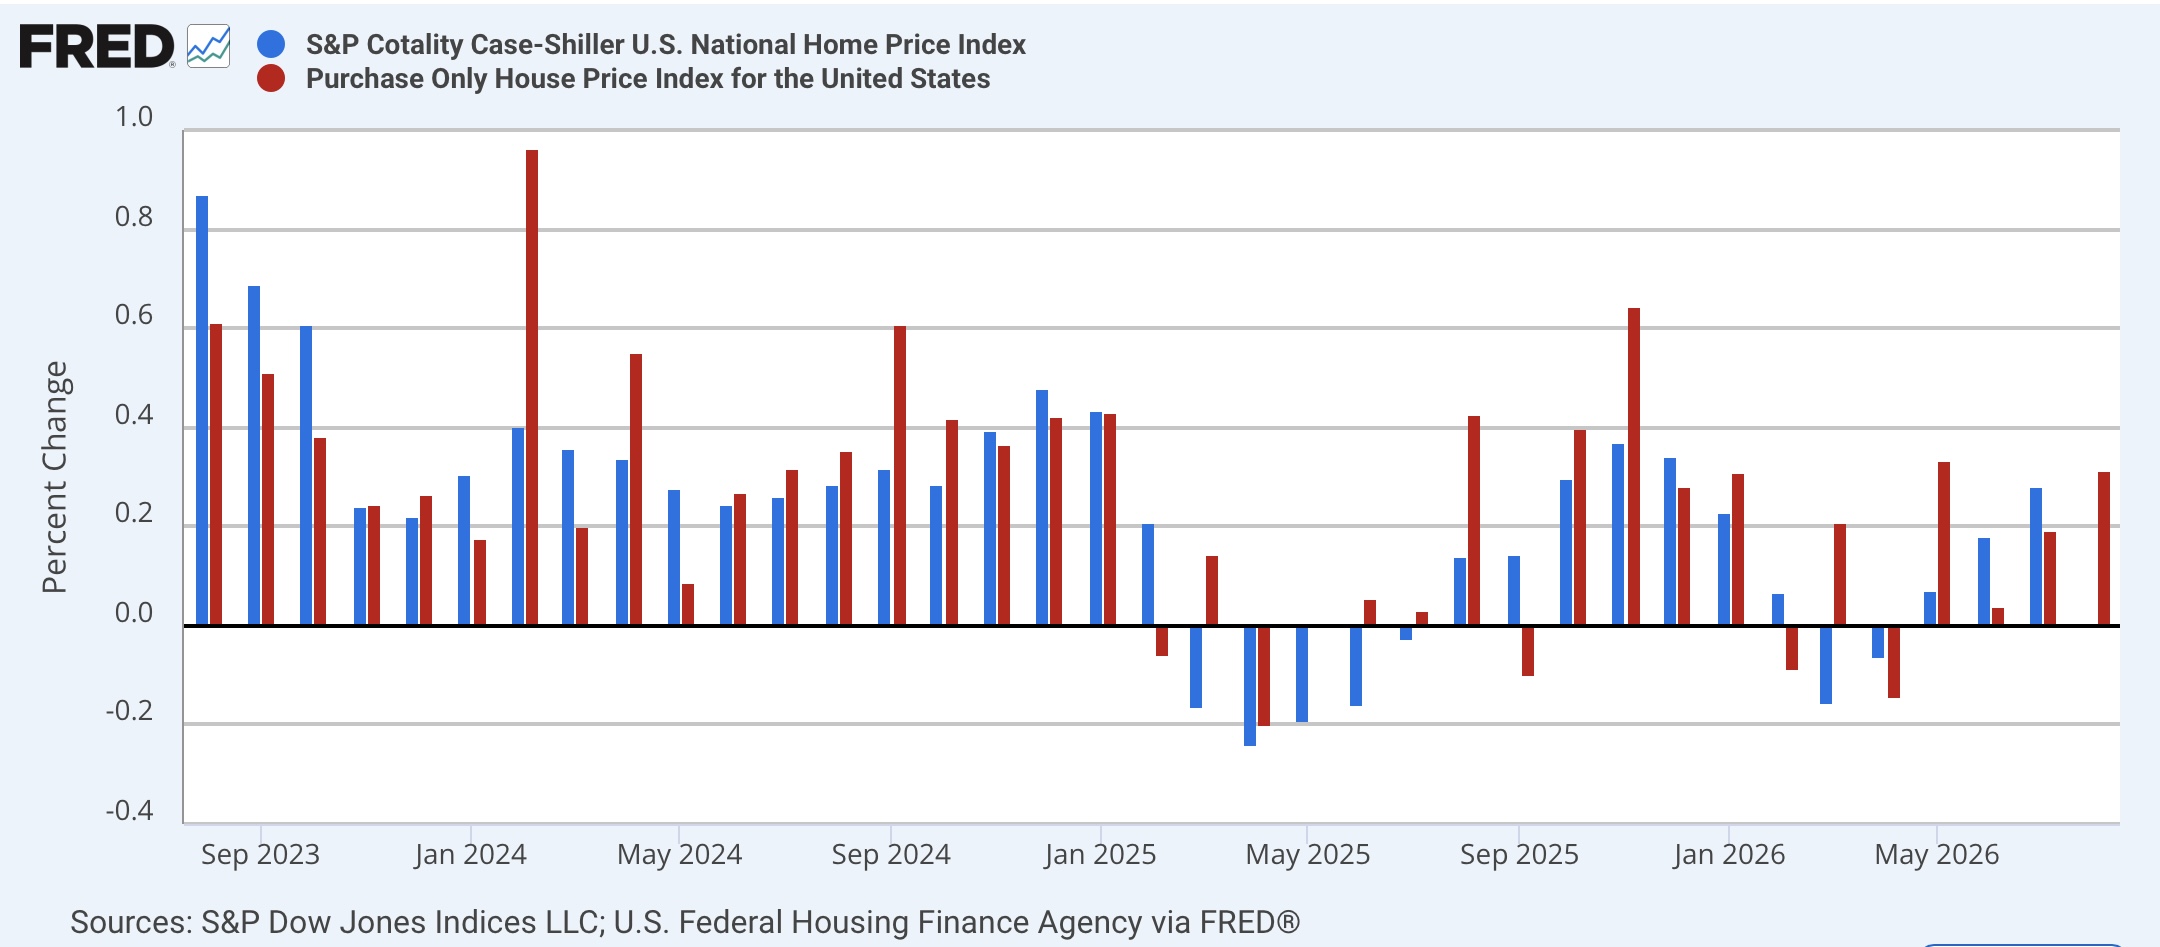
As per the above comment, earlier this year there had been something of a divergence showing in the YoY comparisons of the two national indexes, as the Case Shiller national index had increased less than 1% YoY, while the FHFA Index had accelerated to a 2.0% increase. But in the past several months, the Case Shiller index has followed suit. As of this morning’s report, the FHFA continued to be slightly “hotter” overall, with a 2.4% YoY increase, vs. 2.1% in the Case-Shiller Index.
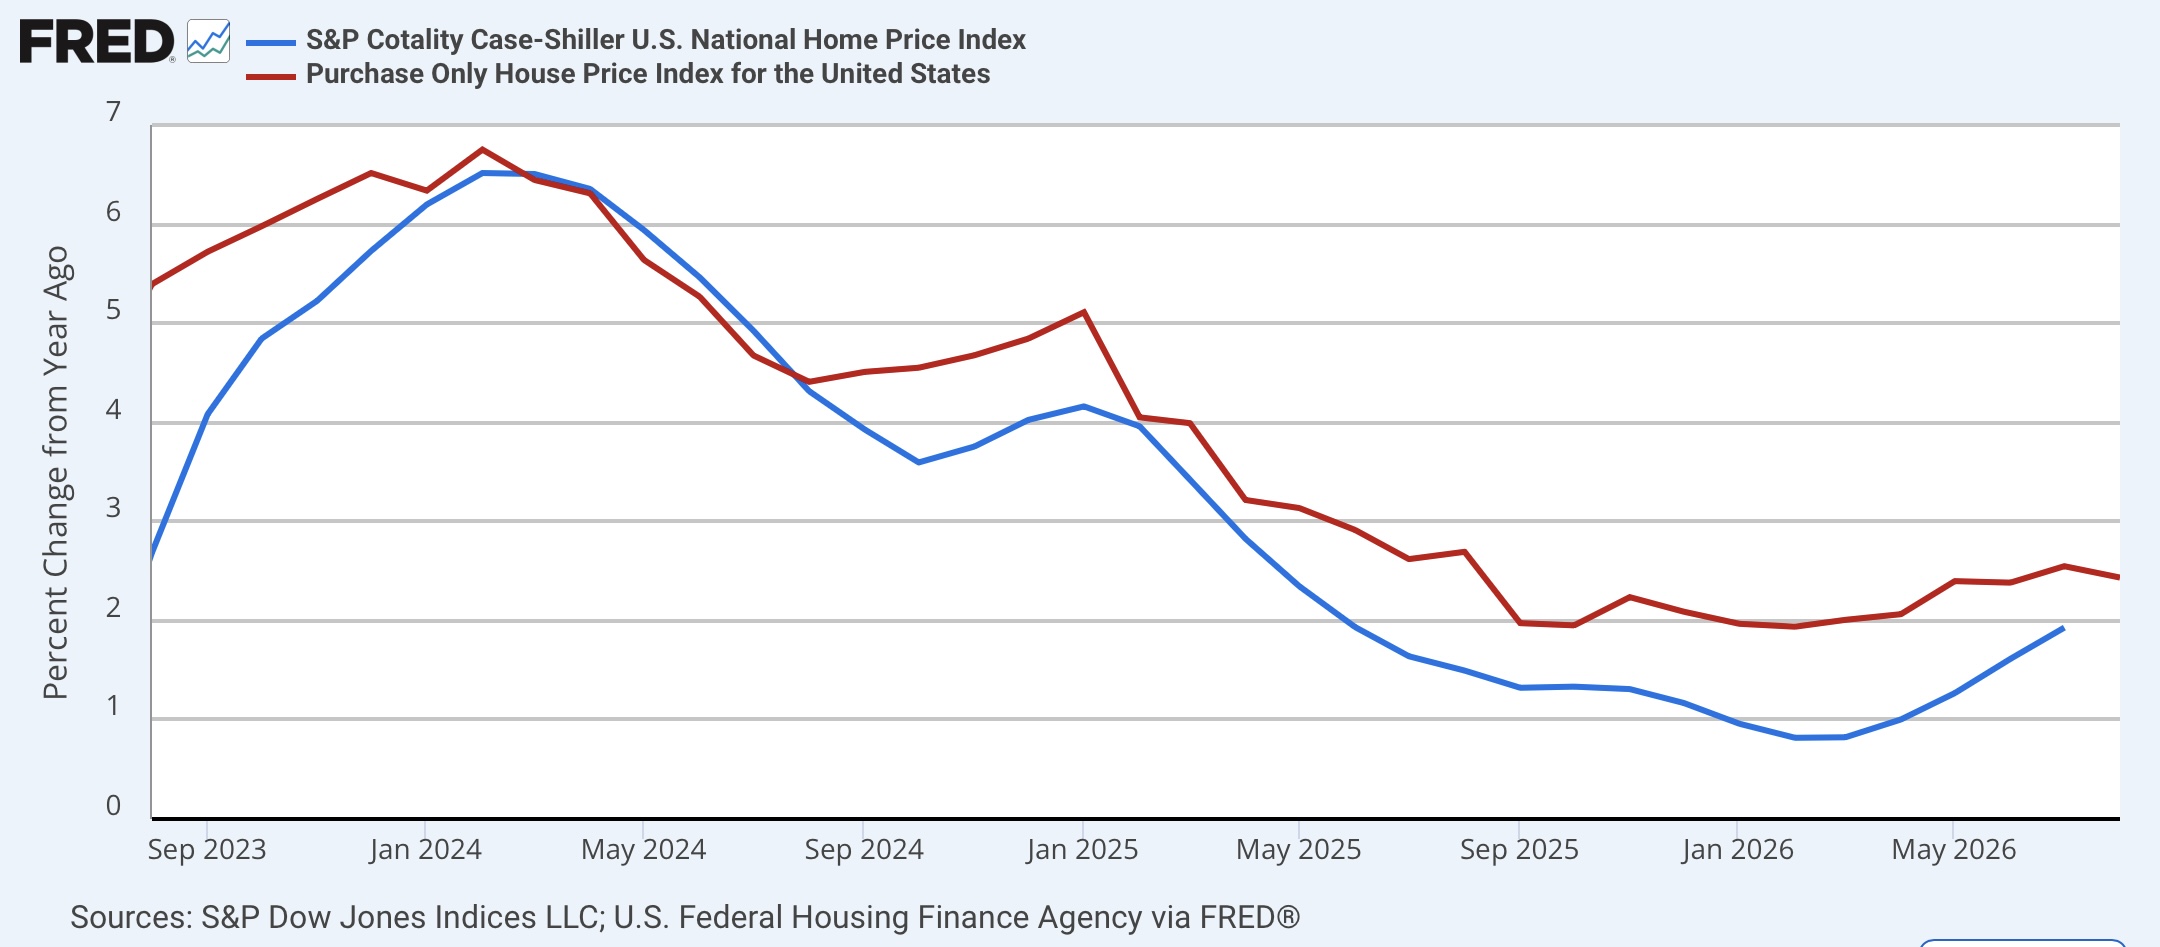
It continues to be the case that it will take considerably more inventory on the market to bring existing homes down to just their average affordability compared with the past 30 years.
Both of this morning’s reports discussed above may have been the last for the current trends. Higher mortgage rates have badly hit mortgage applications, and can be expected to his sales and permits for construction within a month or two. Prices will only react after that, and the inventory of new homes in particular can be expected to increase again. If there is a silver lining, it is that builders have been steadily making their new homes for sale more affordable as a multiple of average earnings.


Comments
Log in or sign up to join the conversation.