

In this series, we scale-back and look at the broader technical picture to gain a bit more perspective on where we are in trend. The US Dollar Index turned from slope major resistance into the close of 2018 with the recent sell-off breaking below multi-week range support. Here are the key targets & invalidation levels that matter on the DXY weekly chart.
DXY WEEKLY PRICE CHART
(Click on image to enlarge)
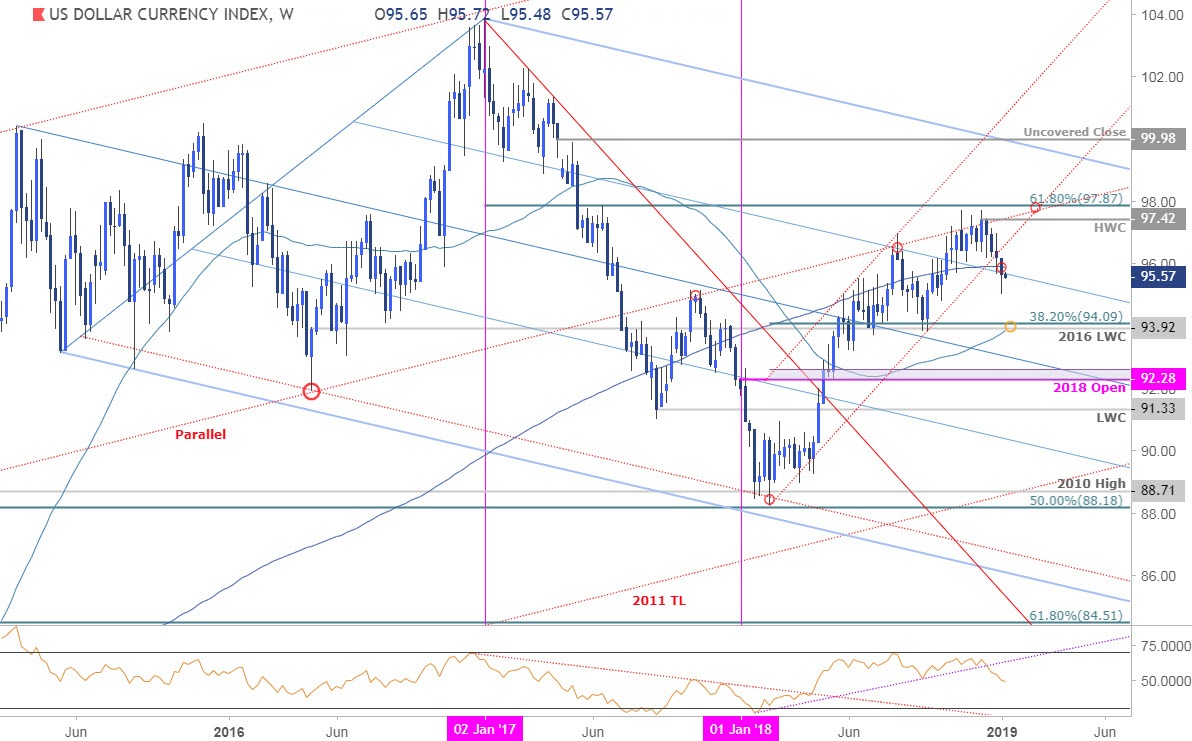
Notes: For months now we’ve been tracking resistance in the US Dollar Index along with the parallel of the 2011 trendline (red) with the broader long-bias at risk heading into the 61.8% retracement of the 2017 decline at 97.87. Price held a range below this threshold for nearly nine-weeks before breaking below 2018 channel support early in the year.
A close below the 200-week moving average (currently 95.90s) is needed to keep the immediate focus lower with the next major support objective eyed at 93.88 -94.09- a region defined by the 52-week moving average, the 38.2% retracement of the 2018 range and the 2016 low-week close. Resistance now stands with the high-week close at 97.42 with a breach above 97.87 still needed to fuel the next leg higher in the greenback.
Bottom line: The US Dollar Index has turned from a multi-year slope inflection with price now threatening a break of below 2018 uptrend support. IF price is indeed heading lower, advances should be capped by 97.42with a break lower from here targeting the critical support confluence around the 94-handle. W



Comments
Log in or sign up to join the conversation.