
NFP DISAPPOINTS, USD BULLS RESPOND TO QUICK PULLBACK TO BRING FRESH HIGHS
April Non-Farm Payrolls data was released out of the United States this morning, and the headline number came-in with disappointment as the +163k print was unable to match the expectation of +191k. On the bright side, the unemployment rate did drop to a fresh 17-year low, printing at 3.9% versus the expectation of 4% flat; but offsetting that positivity was Average Hourly Earnings coming-in at the same 2.6% as last month, and this was against an expectation for a rise to 2.7%. Given the focus on inflation as markets attempt to gauge whether the Fed is headed for a total of three or four hikes in 2018, and the Average Hourly Earnings portion of the this morning’s report may get a bit more attention as we move deeper into the month of May.
In response, the US Dollar put in an initial move of weakness that was quickly met with buyer support. Prices moved back to their pre-NFP levels, and after a few minutes of congestion, bulls punched up to a fresh 2018 high. The move has yet to show significant continuation potential, as buyer demand diminished when trading above the prior high of 92.82.
US DOLLAR VIA ‘DXY’ 15-MINUTE CHART: BUYER SUPPORT (RED) PUSHES UP TO FRESH 2018 HIGHS (BLUE)
(Click on image to enlarge)
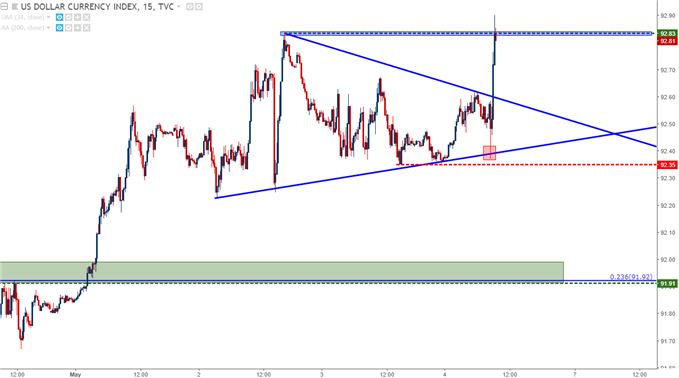
Chart prepared by James Stanley
On a longer-term basis, the big question is whether this morning’s data supports the thesis of a stronger US Dollar. The Greenback has been jumping of recent, gaining as much as 4% from the mid-April lows. But – the move has been rather sharp with nary a pullback, giving rise to the idea that what we’ve been seeing can largely be attributed to short-cover after a really brutal prior year. While many can point to March US inflation figures coming in at one-year highs, driving expectations for a more hawkish Fed that may be able to put in a fourth rate hike in 2018, the fact of the matter is that not much has changed here.
Inflation has been at or above the Fed’s target for months, and prices in DXY (the US Dollar) put in a fresh low a few days after that inflation figure was released last month. It wasn’t until we got the dismal inflation print out of the UK that US Dollar strength really got started, and given how loaded GBP/USD had become on the basis of rate hike bets for the May rate decision out of the BoE, this made sense. As those rate hike bets priced-out of Cable, strength flowed back into the US Dollar; and when the ECB came to the table a week later with a rather dovish outlay, that move of US Dollar strength really began to hasten.
That has largely continued, and this week saw DXY punch up to a fresh 2018 high after the FOMC rate decision on Wednesday. We saw a bit of congestion at that point, and that congestion held into this morning, and now we have prices back at those highs as we move towards the close of this week.
US DOLLAR VIA ‘DXY’ DAILY CHART: OVERBOUGHT CONDITIONS OF RELATIVE STRENGTH
(Click on image to enlarge)
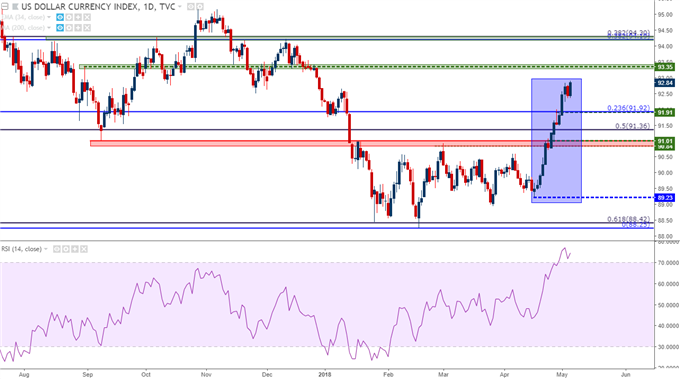
Chart prepared by James Stanley
GBP/USD IN THE SPOTLIGHT FOR BANK OF ENGLAND ‘SUPER THURSDAY’
The big item on next week’s calendar is the Bank of England’s ‘Super Thursday’ rate decision. This is when the bank will also release fresh forecasts while also providing an accompanying press conference around the event to further explain context. Expectations were running high for a hike at this meeting for a large portion of 2018, driven largely by the exuberant inflation that was showing in the UK. For much of last year, inflation remained above 3%; and while the BoE hiked rates in November, we didn’t see inflation really begin to soften until the past couple of months.
When March inflation figures printed at a disappointing 2.5%, GBP/USD posed an aggressive bearish reversal, and three weeks later we’ve seen more than 800 pips erased from the pair. There have been some additional bearish cues in the meantime, and now it looks as though we may have to wait until August or perhaps even November to get that next rate hike from the Bank of England.
A week ahead of that rate decision and GBP/USD is oversold from numerous vantage points. Relative Strength in the pair is at its lowest levels since the ‘flash crash’ in October of 2016, and prices are making a fast approach to a key area of interest around 1.3500. This is a psychological level that’s previously exhibited multiple iterations of support/resistance, and this is very near the 50% retracement of the ‘Brexit move’ in the pair which comes in at 1.3478.
GBP/USD DAILY CHART: OVERSOLD CABLE APPROACHING KEY CONFLUENT SUPPORT ZONE 1.3500
(Click on image to enlarge)
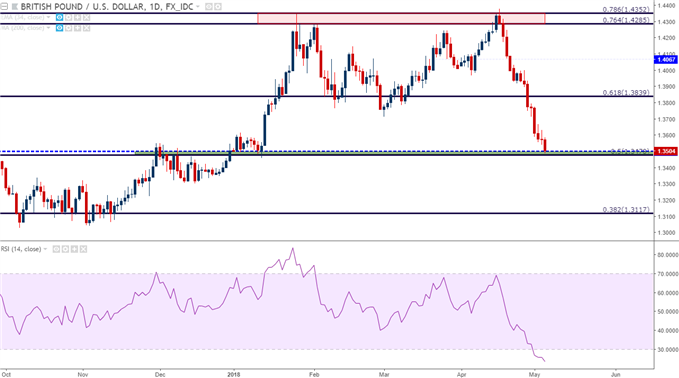
Chart prepared by James Stanley


Comments
Log in or sign up to join the conversation.