

US DOLLAR BOUNCES AHEAD OF THE FED
Today at 2 PM ET brings the Federal Reserve’s September rate decision, and the wide expectation is that we’ll be seeing a 25 basis point hike to mark the third such move out of the FOMC in 2018. But a hike today has long been expected, and the Fed has been fairly clear about this fact, so as we move into today’s rate decision, today’s hike is likely baked into current prices.
The bigger question is the Fed’s take on forward-looking economic conditions, and whether the bank begins to lay the groundwork for a December hike and continued hawkishness as we move into 2019. Odds for another hike in December have continued to hold rather strong, with current probabilities showing at 83.7%. Going out to next year, however, brings far more variability: There’s a 19.1% chance that we see four more 25 basis point hikes (which would be five total, including today) going out to October of next year, and a 50.8% chance of seeing three hikes after today’s ahead of October 2019.
This is where we might see movement around the US Dollar: If the Fed ramps up hawkishness towards 2019, we could see USD break its recent trend of weakness, if only temporarily. Given this week’s performance in the Dollar, it could be reasonable expect a small bump-higher before bears might really be able to pounce. There’s still a tinge of bearish price action as the resistance area around 94.33 continues to hold the near-term highs, but each resistance response this week has carried a smaller reaction, indicating that bears might be soon taking a step back.
US DOLLAR TWO-HOUR PRICE CHART: RESISTANCE REMAINS, BUT CARRYING LESS EFFECT
(Click on image to enlarge)
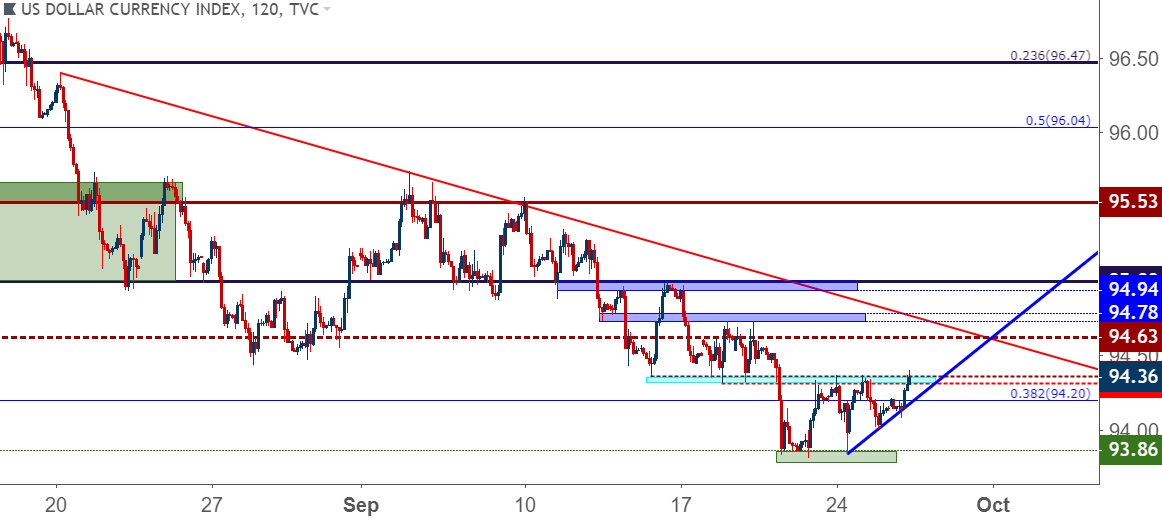
Chart prepared by James Stanley
We discussed this theme in-depth in yesterday’s webinar, and given the backdrop from what Q3 has brought to USD price action, it would not be surprising to see the currency move back for a test of the Q3/July open at 94.63. If we close near that level, it would give us the net of a Doji over the past three months despite considerable volatility throughout the period. This would also keep the case for bearish strategies in the Dollar for Q4 as rather attractive, as the bullish burst from April and May just went through four months of grind with the net result being a weaker US Dollar. This is evidence that USD bulls could not extend the move despite a litany of reasons and motivations to do so, and this highlights the potential for a return of the bearish drive that became so commonplace and built-in during the 2017 down-trend in USD.
US DOLLAR DAILY PRICE CHART: BULLS UNABLE TO HOLD Q2 STRENGTH AS AGGRESSIVELY BEARISH PRICE ACTION SHOWS AFTER MID-AUGUST
(Click on image to enlarge)
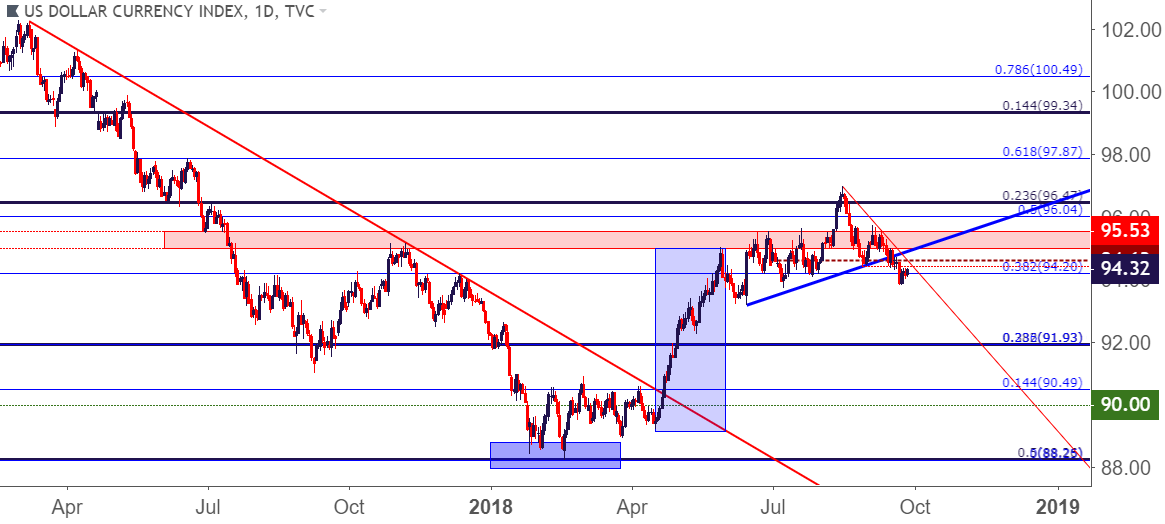
Chart prepared by James Stanley
EUR/USD DROPS TO SUPPORT ZONE AT PRIOR RESISTANCE
Going along with this firming of the US Dollar ahead of today’s FOMC rate decision, we have a support test in EUR/USD as the pair dips into the zone of prior resistance. We looked into this area for higher-low support setups with the aim of bullish continuation, and that filled-in fairly quickly on the new week. Prices soon moved-up for a re-test of the prior July/Q3 high at 1.1791, and have quickly returned back down to the 1.1725 level that we looked at for higher-low support last week.
EUR/USD will likely be the big mover and a primary focal point around today’s rate decision, and another leg of weakness in USD can propel the pair to fresh highs while strength in USD, as brought upon by a more optimistic, upbeat Federal Reserve can create a deeper support test. On the hourly chart below, we look at a few additional support levels in EUR/USD in the event that this pullback draws deeper.
The level around 1.1650 looks particularly interesting. This was a price that helped to hold the swing-highs in the pair in early-September but soon came in as higher-low support as bulls began to have their way. If prices do drop below this level ahead of the Q3 end, bullish strategies in EUR/USD will come into question, at least on a near-term basis until more signs of strength are seen.
EUR/USD HOURLY PRICE CHART: BULLS ATTEMPT TO HOLD HIGHER-LOW SUPPORT IN KEY ZONE
(Click on image to enlarge)

Chart prepared by James Stanley
Taking a step back to the Daily chart, we can see why this current area or zone is so important to bullish continuation strategies in the pair as we move into Q4. This zone helped to hold the highs for the second half of July, and we began to re-test this area as resistance in late-August. But – as bulls persisted, resistance finally gave way as we saw a strong topside breakout last week.
Enthusiasm has been lacking, however, and a hold of this support would be a key signal from bulls that they might continue to defend the bid as we trade towards the end of 2018.
EUR/USD DAILY PRICE CHART: TESTING A KEY ZONE
(Click on image to enlarge)
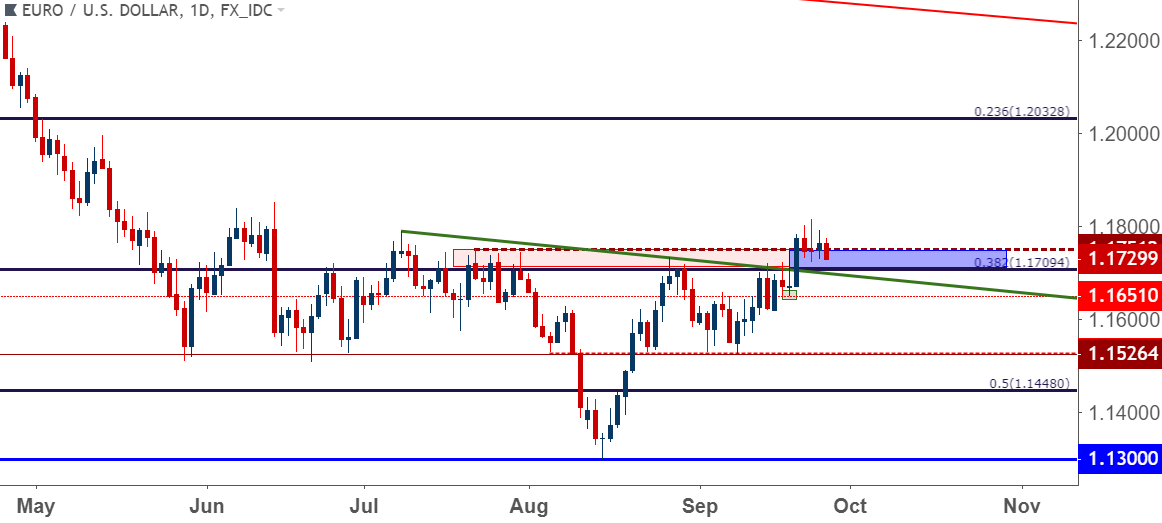
Chart prepared by James Stanley
MARKET TO WATCH FOR TODAY: THE JAPANESE YEN
Somewhat lost in the shuffle of the US Dollar and EUR/USD breakout from last week has been the development of a strong and consistent trend in USD/JPY, and this goes along with that topside breakout that’s been taking place in the Nikkei. The index is fast approaching 27-year highs, and there is something going on around Japan.
We looked into this setup coming into September as the market had just built into an ascending triangle pattern, which will often be approached for bullish breakouts. The horizontal resistance from the pattern was coming from the 50% marker of the 28-year move in the index and had helped to hold the highs in the Nikkei for most of the summer. That breakout hit fairly quickly, and bulls have continued to push for most of the month.
NIKKEI MONTHLY PRICE CHART: BULLISH BREAKOUT FAST APPROACHING 27-YEAR HIGHS
(Click on image to enlarge)

Chart prepared by James Stanley
In the Japanese Yen, we’ve seen a pattern of weakness develop over the past three weeks that’s difficult to ignore. The pair is testing Q3/July highs at the moment after a strong, consistent trend has developed, and this is remarkable considering how weak the US Dollar has been in September; highlighting that the Yen has been even weaker.
USD/JPY HOURLY PRICE CHART: A CONSISTENT TREND PRESENTS ITSELF, DESPITE USD'S STRUGGLES
(Click on image to enlarge)

Chart prepared by James Stanley
As we’ve been discussing, that Yen weakness may be more attractive elsewhere as the Dollar is apparently going through its own themes at the moment. We’ve been following EUR/JPY as a way of capitalizing on a continuation of this Yen weakness without having to incorporate too much USD-risk. As we approach today’s FOMC rate decision, EUR/JPY is holding resistance hear five-month highs; but if we see a pullback to the prior resistance area around 132.05, bullish strategies can become attractive.
EUR/JPY EIGHT-HOUR PRICE CHART: SUPPORT POTENTIAL AT PRIOR RESISTANCE
(Click on image to enlarge)

Chart prepared by James Stanley



Comments
Log in or sign up to join the conversation.