

US DOLLAR FINDS RESISTANCE, US EQUITY RECOVERY CONTINUES AHEAD OF POWELL SPEECH
The US Dollar is seeing a bit of resistance in the bullish move that came back to life a week ago. While last Tuesday brought in a support test at a key Fibonacci level in the currency, the following week saw buyers come back with gusto as the US Dollar re-claimed ground above the 97.00 level. But, since hitting resistance at the psychological level of 97.50 yesterday, bulls haven’t been able to make much progress, and this is likely due to the fact that a big speech is on the calendar for later today when FOMC Chair Jerome Powell speaks at the Economic Club of New York. This is on the docket for Noon Eastern Time, so right in the middle of the US trading session.
US DOLLAR HOURLY PRICE CHART
(Click on image to enlarge)

Chart prepared by James Stanley
FED POLICY AS A MACRO PRESSURE POINT
FOMC policy has recently come into the picture as a pressure point for global markets, joining themes of Brexit, the Italian budget, and trade wars/tariffs. While the rest of these risks have existed and even been known for some time, it’s only recently that the ‘wall of worry’ has appeared to impact equities in the United States. Throughout Q3, while Brexit remained messy and while the potential stand-off between Italy and the European Commission was in full view, US stocks continued to rally up to fresh all-time-highs, and this was taking place along with increased tension on the trade tariff front.
It wasn’t until we turned the page into Q3 that this started to change, and October ushered in a far different tonality in US risk markets than what was seen just a month earlier. Comments earlier in the month from FOMC Chair Jerome Powell appeared to frighten market participants when the head of the world’s largest Central Bank indicated that the FOMC was ‘far away from the neutral rate.’
This would imply more rate hikes in the future as the bank strives to attain that rate that’s neither stimulative nor restrictive, and on the heels of these comments stocks started to show pressure, and that lasted into the end of the month. What did seem to finally help were some comments in late-October at FOMC Vice Chair Richard Clarida’s first public engagement, when he said that ‘some further gradual tightening’ will be needed, indicating that the neutral rate might be closer than Mr. Powell had previously hinted at. This helped stocks to build-in some support, and prices rallied through the first week of November.
DOW JONES DAILY PRICE CHART: Q3 STRENGTH YIELDS TO OCTOBER WEAKNESS; NOVEMBER RECOVERY STOPS AROUND FOMC
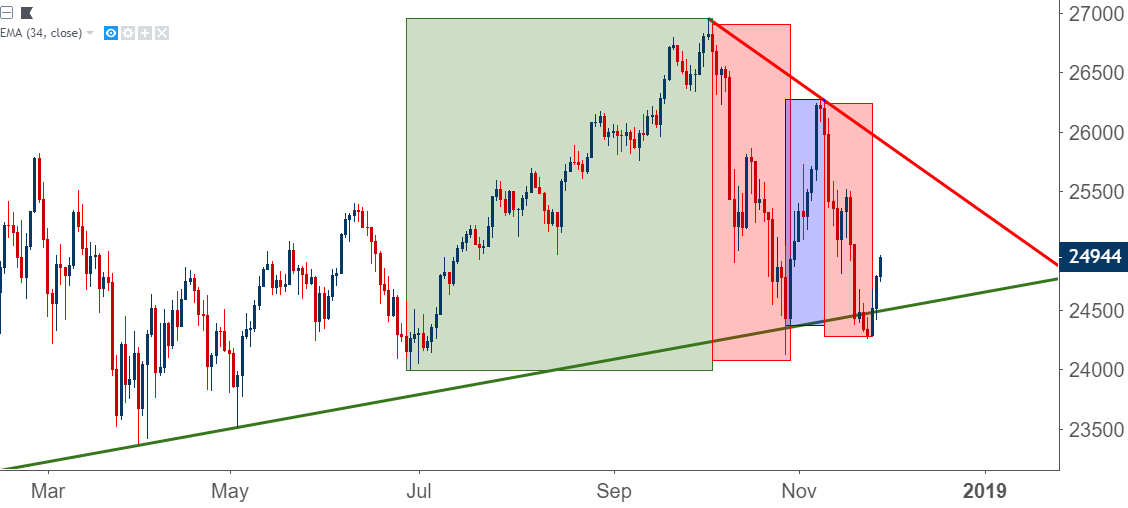
Chart prepared by James Stanley
That recovery was soon halted around the FOMC’s November rate decision. US stocks topped-out around this meeting and that recovery was soon yielding to sellers and lower prices. That weakness remained into last week’s close, and a bit of recovery has started to show around this week’s open. This appears to be in anticipation of the Powell speech on the calendar for later this afternoon, with the expectation that we may see a slightly softer stance than what took place in October. Given that the November rate decision did not carry an accompanying press conference, this would be an ample opportunity for Chair Powell to opine on the state of global markets in relevance to FOMC policy.
SPX 500 DAILY PRICE CHART: ATTEMPTING TO BOUNCE FROM HIGHER-LOW SUPPORT
(Click on image to enlarge)
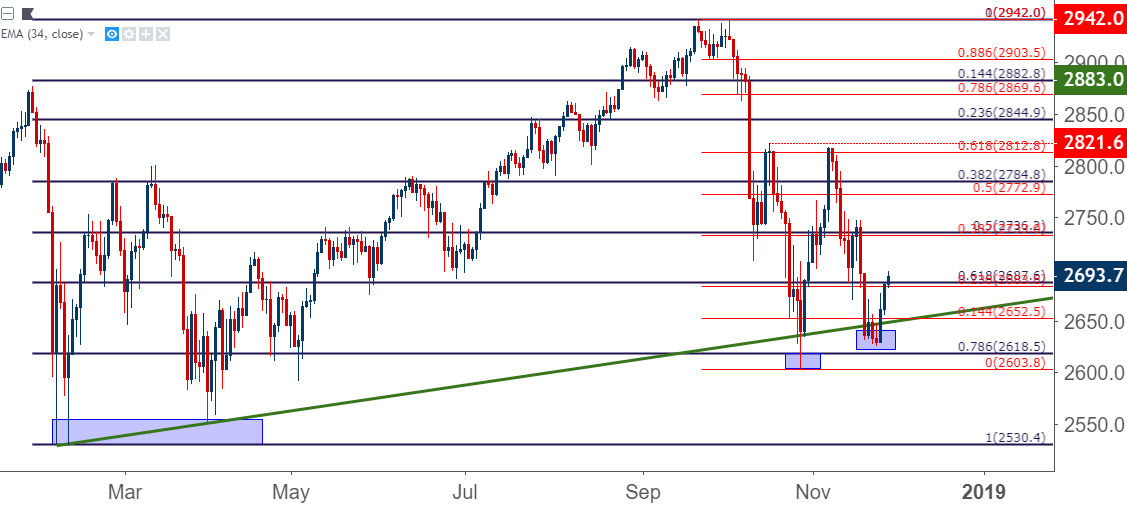
Chart prepared by James Stanley
US DOLLAR PULLBACK OR REVERSAL POTENTIAL
Another item of interest around the Fed is the US Dollar, as the currency has been in a bullish trend ever since the September rate hike. This is when the topside channel in the currency began, and over the past couple of weeks, support has started to come into play with greater frequency.
US DOLLAR FOUR-HOUR PRICE CHART
(Click on image to enlarge)

Chart prepared by James Stanley
Yesterday brought an interesting driver into this mix, and as was discussed in yesterday’s webinar, this may have been a case of miscommunication. In a speech early in yesterday’s session, FOMC Vice Chair Richard Clarida said ‘further gradual tightening’ will be needed at the Fed; very similar to albeit slightly different from his comments in late-October when he said ‘some further gradual tightening’ may be needed. The difference here is the word ‘some,’ and because this wasn’t included in yesterday’s comments, ‘some’ market participants inferred this to mean that Mr. Clarida was more hawkish than he was just a month ago.
On the heels of those comments yesterday, the Dollar jumped-higher and stocks probed-lower, illustrating a fairly clear response in each market. As each of those have calmed in the 24 hours since, with the Dollar finding resistance and stocks continuing to rally, traders can move forward with a bit of information that could be useful today. If Jerome Powell is able to sooth market participants’ fears, a deeper pullback could show in the US Dollar to go along with a continuation of this week’s strength in US stocks. But, if he comes out of the gates as he did in October, with visible optimism to go along with some hawkish commentary, US Dollar strength and US stock weakness could soon be back in the cards.
US DOLLAR HOURLY PRICE CHART: SUPPORT POTENTIAL APPLIED
(Click on image to enlarge)

Chart prepared by James Stanley
EUR/USD FINDS RESISTANCE AT 1.1300 BUT BEARS UNMOTIVATED
EUR/USD sellers remained in-charge through this week’s open, helping to bring on another support test at the key level of 1.1300. Bears were able to push through yesterday morning, but there wasn’t much motivation to continue the move after prices tested below this key level.
Since yesterday afternoon, this price of 1.1300 has helped to provide near-term resistance on the pair. Sellers were even able to tip their toes into the water around this morning’s European open, leading to a quick test below yesterday’s lows before buyers soon pushed prices right back into that prior short-term range. While it’s unlikely that we’ve seen total capitulation at this point, this could be a signal that the pair is ripe for a pullback as sellers have been able to bring much drive below 1.1300. If the ground was open for further downside, sellers had ample opportunity to push-lower following this short-term support break earlier this morning. But they didn’t, and Euro bears should question ‘why.’
EUR/USD FOUR-HOUR PRICE CHART
(Click on image to enlarge)
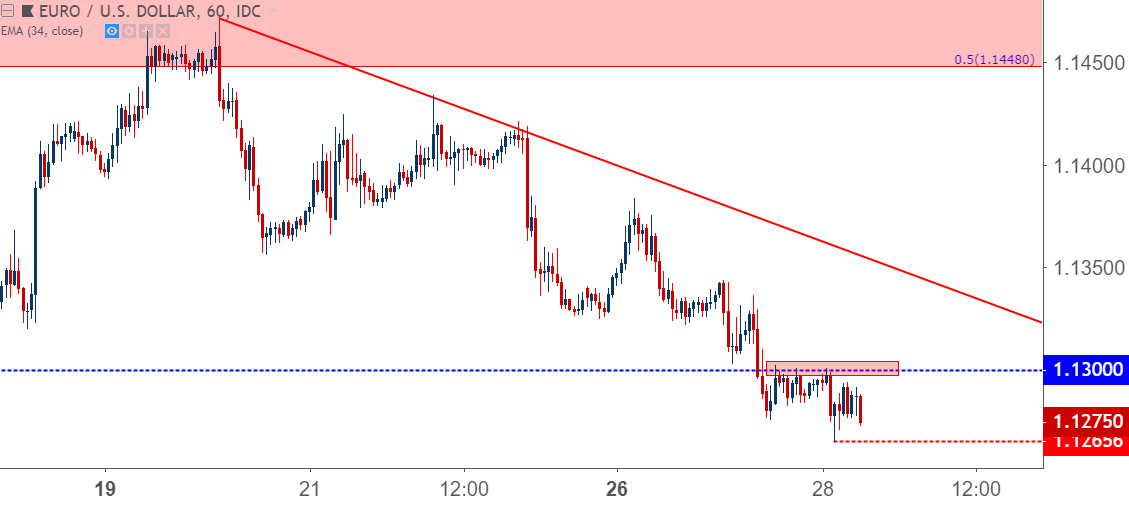
Chart prepared by James Stanley
GBP/USD HOLDS TREND-LINE SUPPORT
In yesterday’s webinar, I looked at GBP/USD setting up in a potential bear trap. While bulls appear to have been on hiatus around the pair over the past few weeks, the bigger item of concern for short-side continuation was the build of support around a long-term level of interest.
In mid-August, the yearly low in the pair printed off of the 23.6% Fibonacci retracement of the Brexit move. Since then, multiple downside approaches have been thwarted ahead of this level, and of recent, support has gotten an assist from an old trend-line projection, connecting the flash crash lows in the pair from October of 2016 up to the March 2017 swing lows.
This can make for a difficult spot on the chart for bears, as each short-term support break is met by another support level very nearby. Prices are again bouncing off of this trend-line projection this morning, and this can further complicate bearish continuation approaches.
GBP/USD WEEKLY PRICE CHART
(Click on image to enlarge)
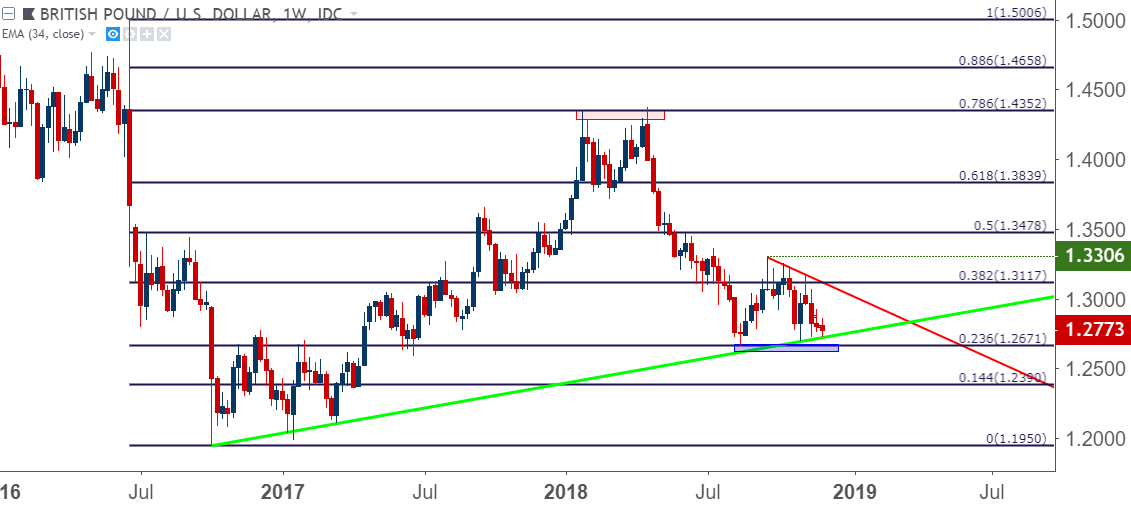
Chart prepared by James Stanley
USD/CAD FRESH FIVE-MONTH HIGHS
For USD-strength strategies, EUR/USD can be difficult given the test at this long-term area of support. Of recent, I’ve been looking to USD/CAD for that driver and the past few weeks have shown multiple items of interest on that front.
Earlier this week, a bullish trend-line came into play after prices pulled back from fresh four-month highs set last week. Buyers quickly returned, and price action has now posed a push up to fresh five-month highs.
Prices are now approaching a big area of resistance from 1.3361-1.3376, as each of these levels are long-term Fibonacci retracements that helped to cauterize the yearly high in June of this year. Traders should tread very carefully at this point, and a pullback towards that trend-line of support may be needed to re-open the door for additional long positions.
USD/CAD DAILY PRICE CHART: BULLISH TREND APPROACHES KEY RESISTANCE
(Click on image to enlarge)
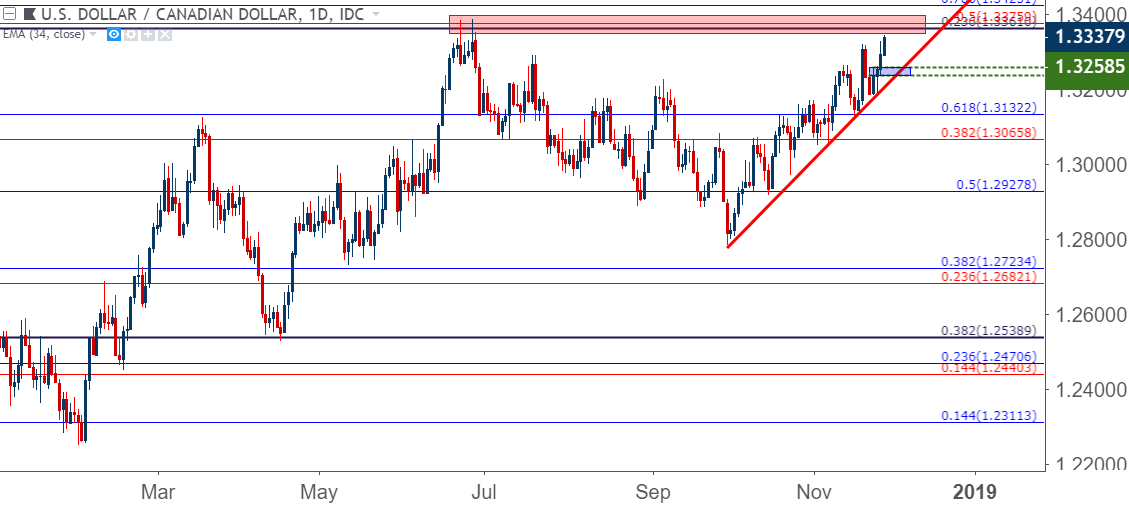
Chart prepared by James Stanley



Comments
Log in or sign up to join the conversation.