

EUROPEAN CENTRAL BANK (ECB), BANK OF JAPAN (BOJ) HIGHLIGHT NEXT WEEK’S CALENDAR
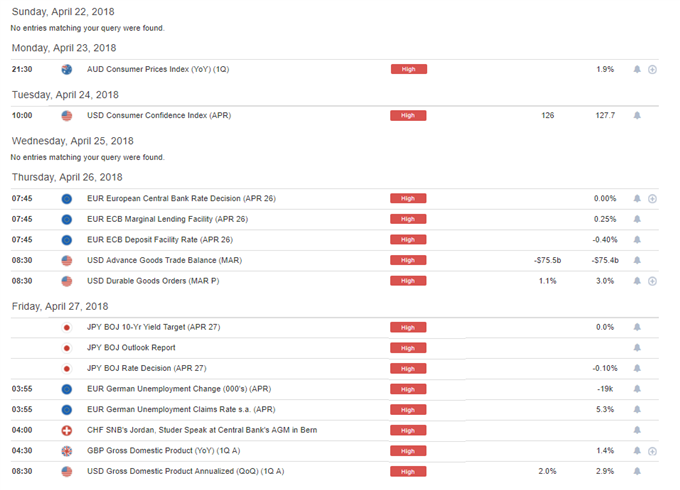
It’s been an interesting week across global markets, as earlier-week breakouts in both the British Pound and US equities were unable to hold, and we’ve already seen reversals to varying degrees in each of those markets. Last night’s Japanese inflation came-in at 1.1%, cooling from the 1.5% from last month and removing a bit of pressure from that theme of Yen strength that began to show in Q1. This opens the door to the possibility of a continuation of Yen weakness as we work deeper into Q2, and as we move into next week that theme will be in the spotlight as we get a Bank of Japan interest rate decision on Thursday/Friday of next week.
Before we get to that rate decision, we have another item of interest in the ECB’s April rate decision set for Thursday morning. Next week’s calendar is back-loaded with these two rate moves in the latter-portion of the week:
DAILYFX ECONOMIC CALENDAR: HIGH-IMPACT ITEMS FOR WEEK OF APRIL 23, 2018
(Click on image to enlarge)
US DOLLAR MOVES BACK ABOVE 90.00: BULLISH BREAKOUT POTENTIAL FOR NEXT WEEK
The US Dollar has been weak. This much is known. And this weakness has happened in a backdrop where monetary policy would generally dictate otherwise, as rates have been rising in the US without much tightening elsewhere. We did get the rate hike out of the UK in November, and we may get another in May, but outside of that, there has been a dearth of rate hikes out of large Central Banks not named the Federal Reserve.
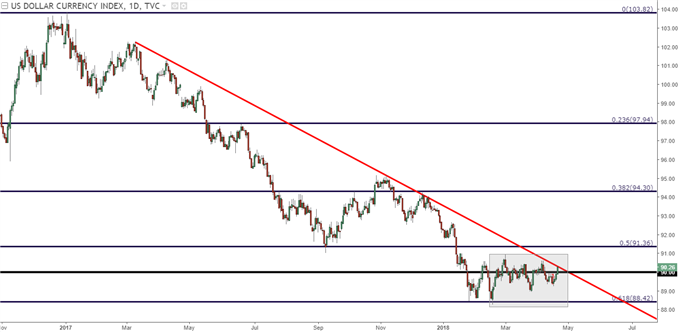
This alludes to the fact that something else has been doing the driving here, and we’ve discussed the likely culprit of fiscal policy in the past. And while that theme may continue on a longer-term basis, we may be nearing an area where a retracement in that built-in down-trend in the US Dollar might be ready to take a break. DXY has not made a fresh low for more than two months, and that happened after support showed at a key Fibonacci retracement. This lack of further lows may be helping to highlight a greater degree of probability for a bullish short-term move in USD.
US DOLLAR DAILY CHART: TWO MONTHS SINCE PRINT OF FRESH LOW
(Click on image to enlarge)
Next week brings rate decisions out of both the ECB and BoJ. Both of these banks could benefit from a weaker currency, and each is or has been trying to stave off calls from market participants to start moving away from uber-loose monetary policy. As inflation was rising in each economy, in Europe through last year and more recently in Japan; those calls were difficult to shrug off, and market participants were buying these currencies on the growing expectation that the ECB and BoJ would be forced into action and away from emergency levels of monetary accommodation.
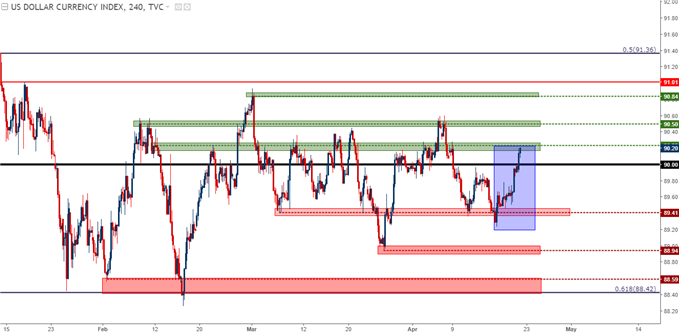
But more recently, inflation has been softening in both Japan and Europe. Last night gave us March inflation data out of Japan at 1.1%, and last month Europe saw 1.4%. This opens the door for dovish outlays at those Central Bank for next week’s rate decisions, which could allow for additional weakness to flow into each of the Euro and the Japanese Yen as pressure is removed. Deductively, this could allow for a deeper move of strength in the US Dollar, testing resistance areas from earlier in the year around 90.50, 90.84, or even the 2017 swing-low at 91.01.
US DOLLAR VIA ‘DXY’ FOUR-HOUR CHART: WEDNESDAY
(Click on image to enlarge)
EUR/USD: BACK TO 1.2300 SUPPORT
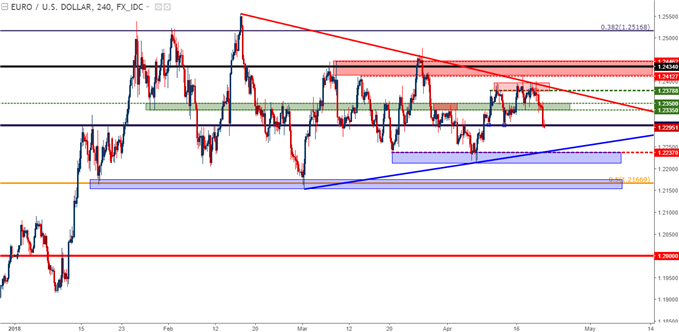
EUR/USD continues to trade within a range that’s become increasingly messy. A bit of support is continuing to show around the 1.2300 handle, and this is the same area that helped to catch the lows last week. As we move into next week, the areas of interest are around 1.2337 and 1.2167, as each helped to play a role in supporting price action in the month of March. The level of 1.2167 could be particularly interesting if we do see a sell-off down to support, as this is a Fibonacci level that’s brought on an active support response in both mid-January and early-March.
EUR/USD FOUR-HOUR CHART: TWO-MONTH RANGE NARROWS INTO A WEDGE PATTERN
(Click on image to enlarge)
USD/JPY CONTINUES IN BULLISH CHANNEL AFTER JAPANESE INFLATION
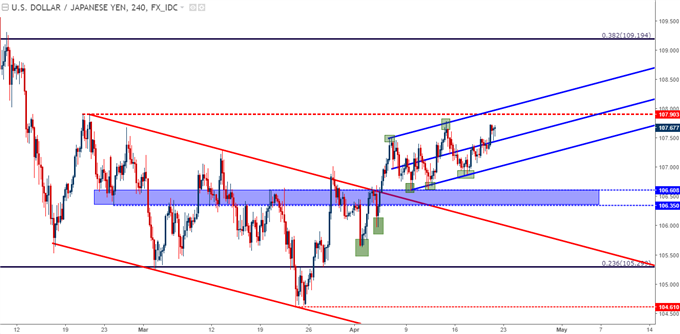
We looked at the trend shift in USD/JPY from Q1 to Q2 in yesterday’s article, and that theme remains alive as we move towards the BoJ’s rate decision on Thursday night/Friday morning of next week. The big item of interest here is at 107.90. This was a swing-high from late-February, and at this point that price constitutes the two-month high in the pair. As we’ve seen bullish price action return to USD/JPY, buyers have continued to provide support at higher-lows; but, to date, that bullish enthusiasm has waned as we’ve moved towards tests of prior highs. If we do see this high taken out, the possibility of bullish continuation will look considerably more attractive in USD/JPY.
USD/JPY FOUR-HOUR CHART: SHIFT INTO BULLISH CHANNEL IN Q2 BRINGS CONTINUATION POTENTIAL
(Click on image to enlarge)
GBP/USD: REVERSAL OF FORTUNE AFTER CARNEY, UK INFLATION
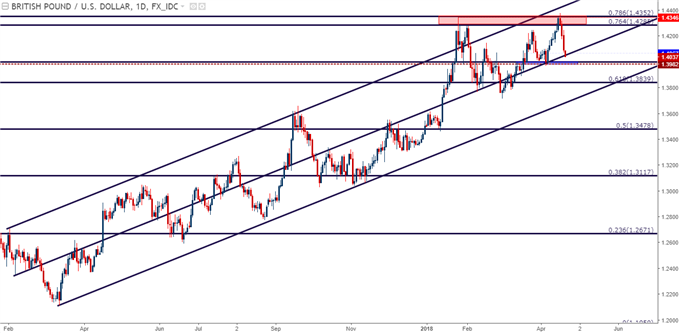
The British Pound has been the big mover this week, continuing a bullish breakout in the early-portion followed by an aggressive reversal after Wednesday morning. That, of course, is when we got inflation numbers out of the UK for the month of March, and that data was not very positive as inflation fell for the second consecutive month. But – inflation does remain well-above the BoE’s 2% target, so there remains strong odds of getting a hike at the May ‘Super Thursday’ rate decision in a couple of weeks.
More pressing, however, is the BoE’s tolerance for the rest of the year, and this was spoken to by the head of the bank, Mr. Mark Carney, in a speech yesterday. Mark Carney’s speech was the cherry on top for Sterling bears, as he took a dovish tone that helped to further that reversal.
At this point, GBP/USD is testing the mid-line of the bullish channel that’s been in force for over a year now, and we’re getting closer to the 1.4000 psychological level. This brings to question the viability of that bullish trend as we move into next week.
GBP/USD DAILY CHART: CABLE CRUMBLES AFTER FRESH POST-BREXIT HIGHS
(Click on image to enlarge)
NZD/USD FOR USD-STRENGTH SCENARIOS
On Wednesday of this week we looked at a short-side setup in NZD/USD, and if US Dollar strength is a theme that might continue, this pair remains an attractive venue. The longer-term setup in the pair is a range, and this range has been alive for almost two years now. Prices have spent around a week in the resistance side of this range, and as USD began to show strength, short-term price action has moved-lower. This opens the door for bearish continuation in NZD/USD, and the next big item of interest for support is around the .7000 psychological level.
NZD/USD HOURLY CHART: KIWI BREAKDOWN CARRIES CONTINUATION POTENTIAL
(Click on image to enlarge)
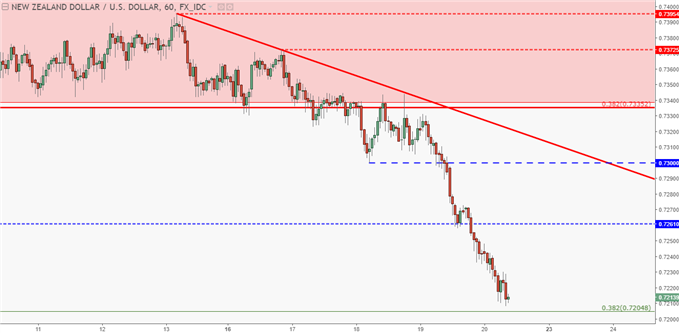
Chart prepared by James Stanley



Comments
Log in or sign up to join the conversation.