

EUR/USD
4 hour
(Click on image to enlarge)
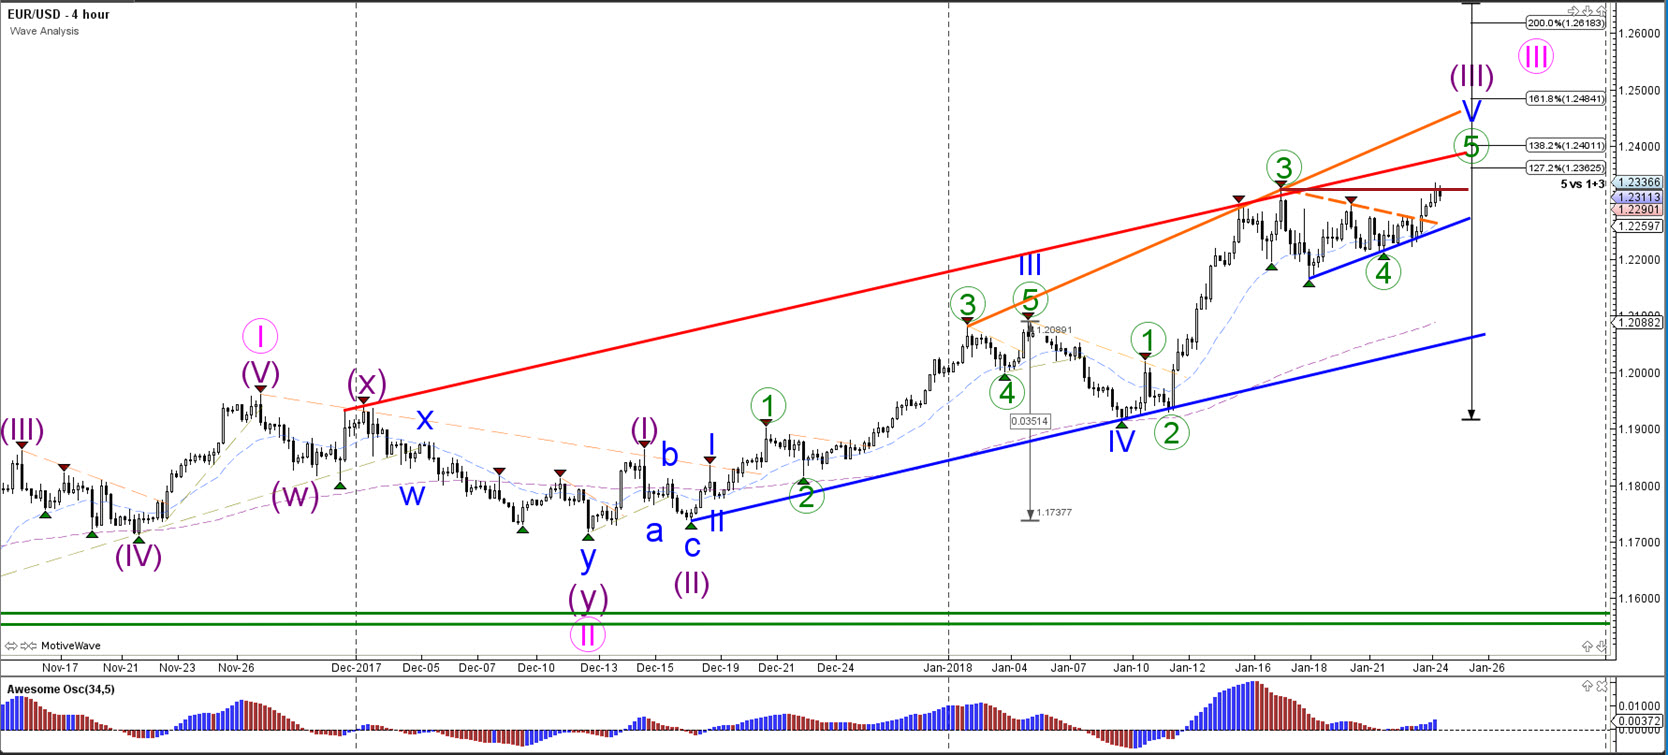
The EUR/USD broke above the resistance (dotted orange) of the triangle chart pattern, which could mark a continuation of the uptrend. A break above the previous top (dark red) could see price move towards the Fibonacci targets of wave 5 (blue) at 1.24 and 1.25.
1 hour
(Click on image to enlarge)
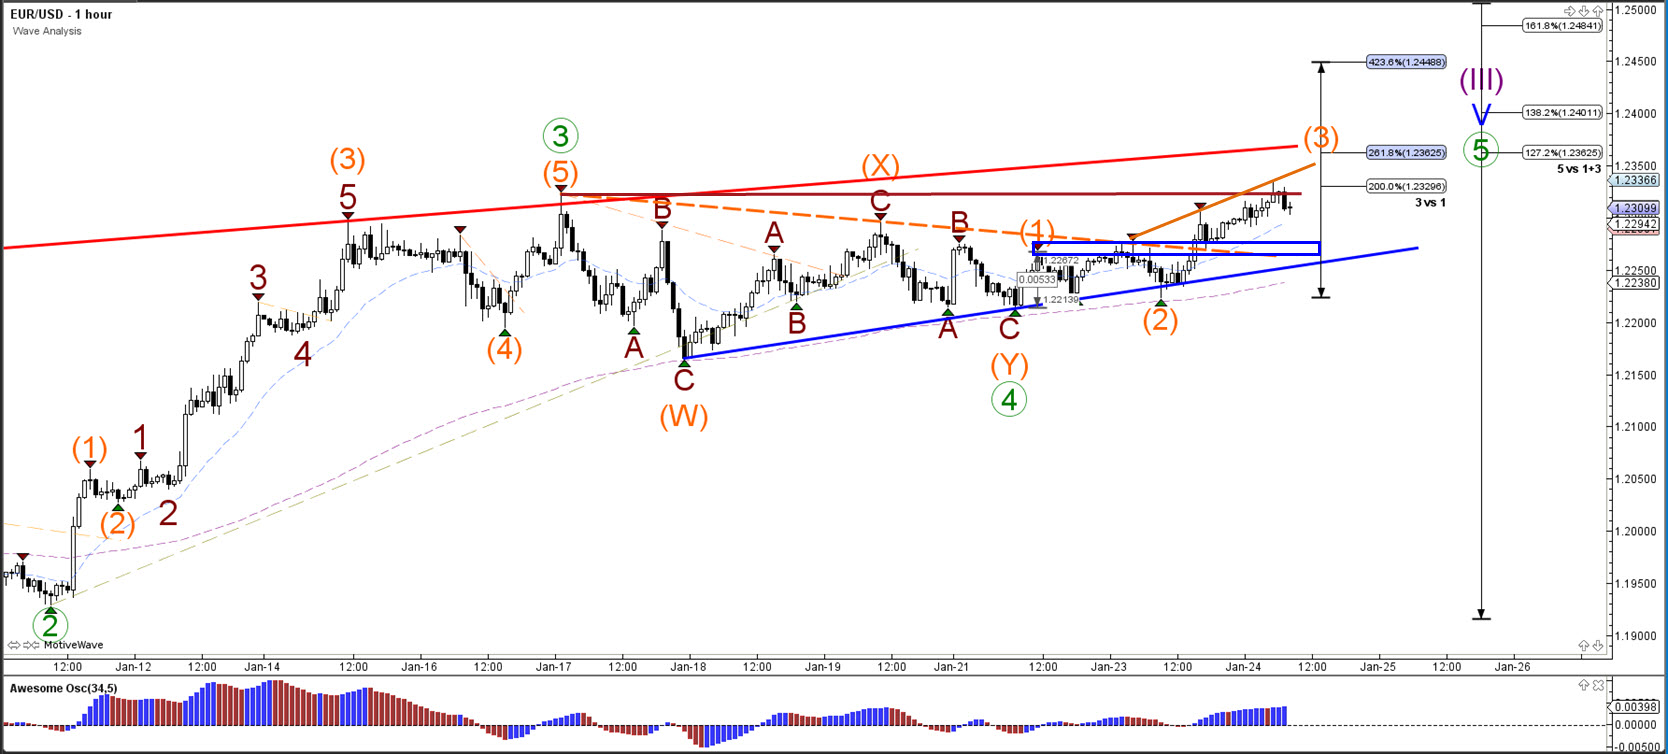
The EUR/USD is challenging the previous top which could cause a potential retracement. If a pullback does occur, then the broken tops (blue) could become future support. A bullish breakout however could price move towards the 261.8% Fib target at 1.2362 and higher targets such as 1.24 and 1.25.
GBP/USD
4 hour
(Click on image to enlarge)
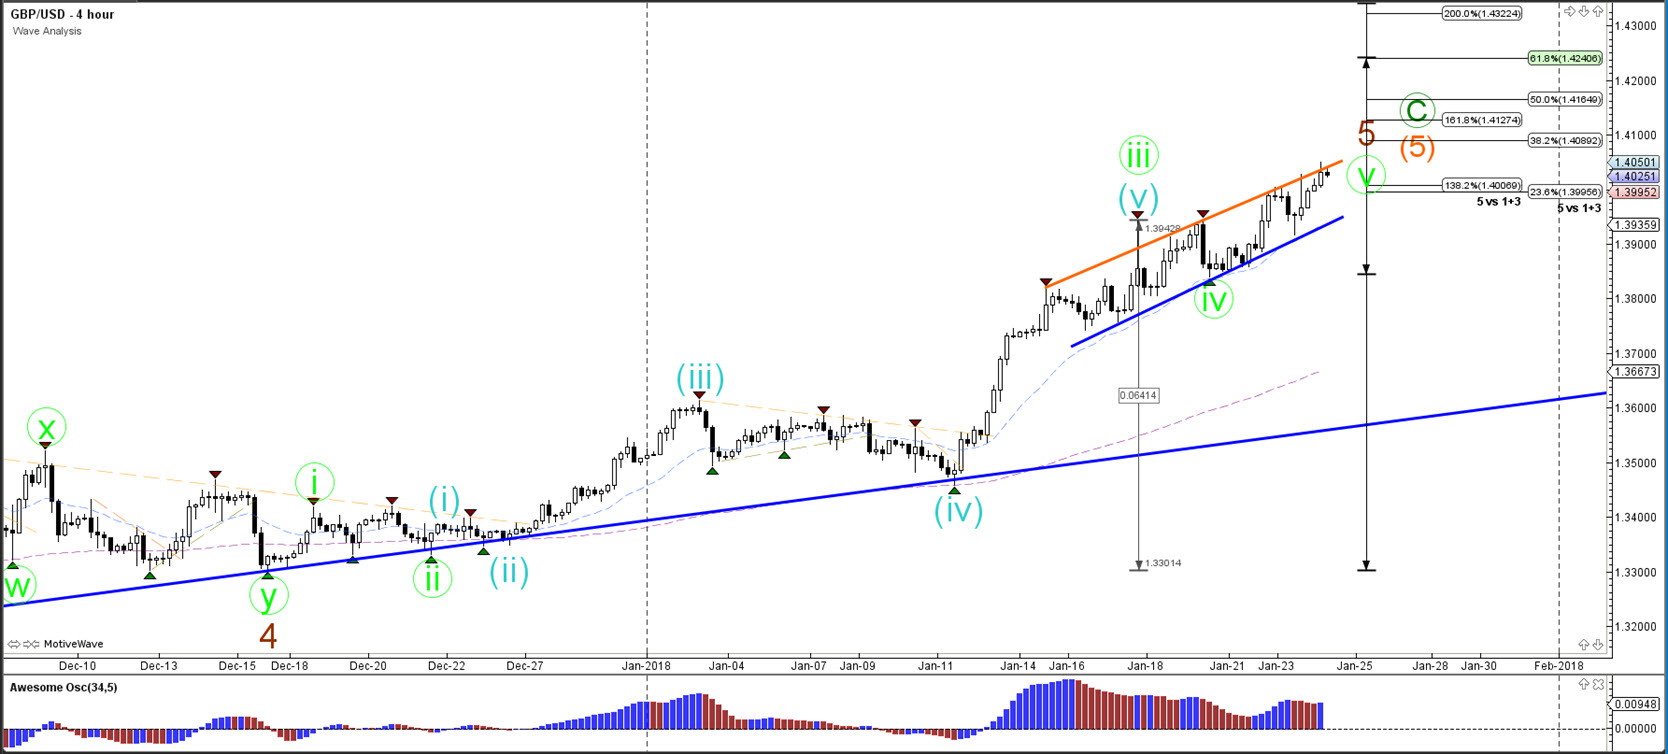
The GBP/USD bullish channel broke above the 1.40 resistance and is moving towards the Fibonacci targets. Price has reached the upper trend line (orange) of the bullish channel which could act as a potential resistance.
1 hour
(Click on image to enlarge)
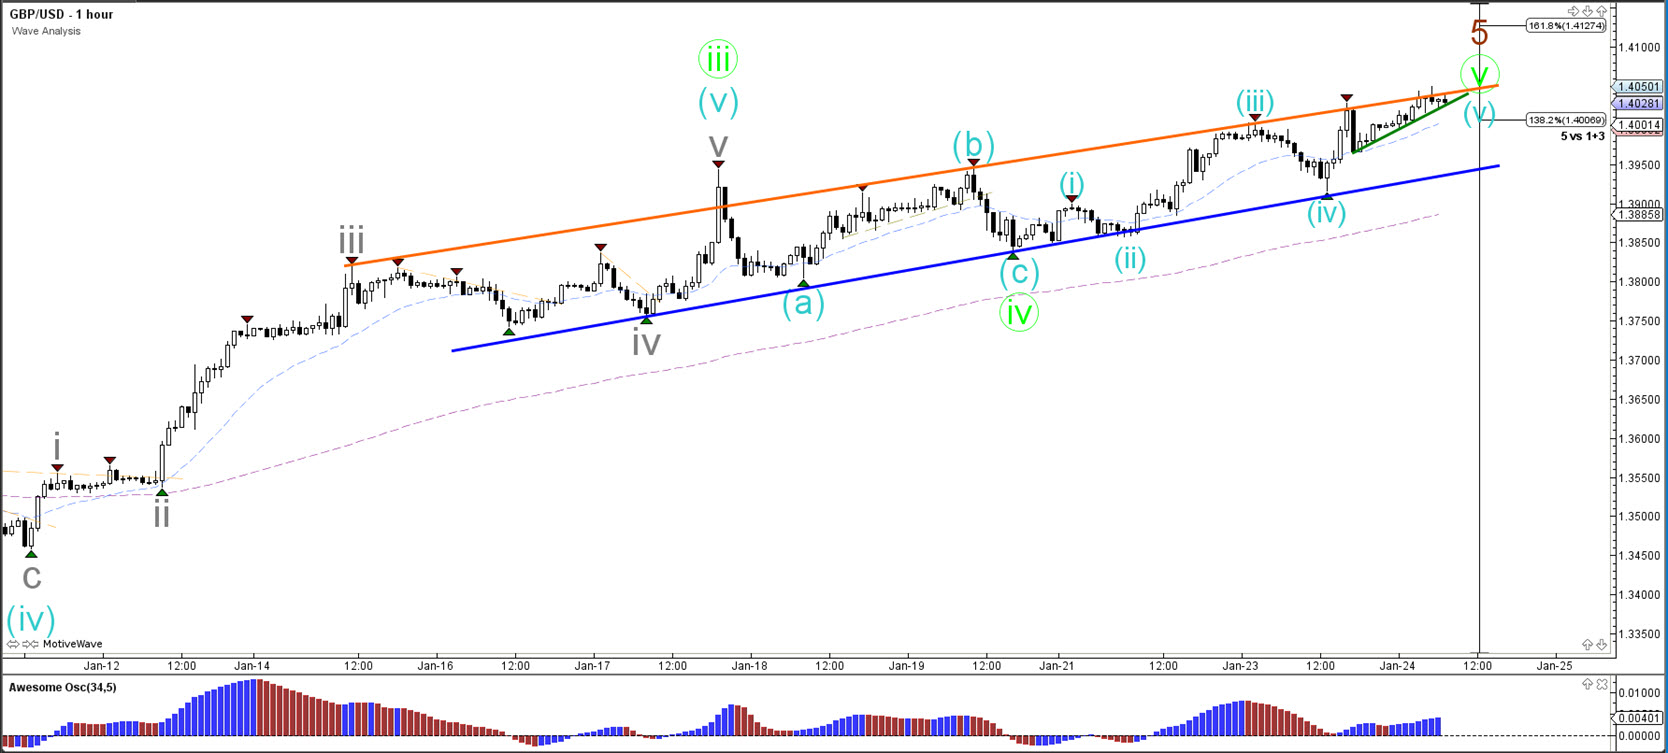
The GBP/USD indeed completed a wave 3-4 (blue) pattern as expected in yesterday's analysis. Price could be in a wave 5 (blue) now. A bullish breakout could see price move towards the 161.8% Fibonacci target.
USD/JPY
4 hour
(Click on image to enlarge)
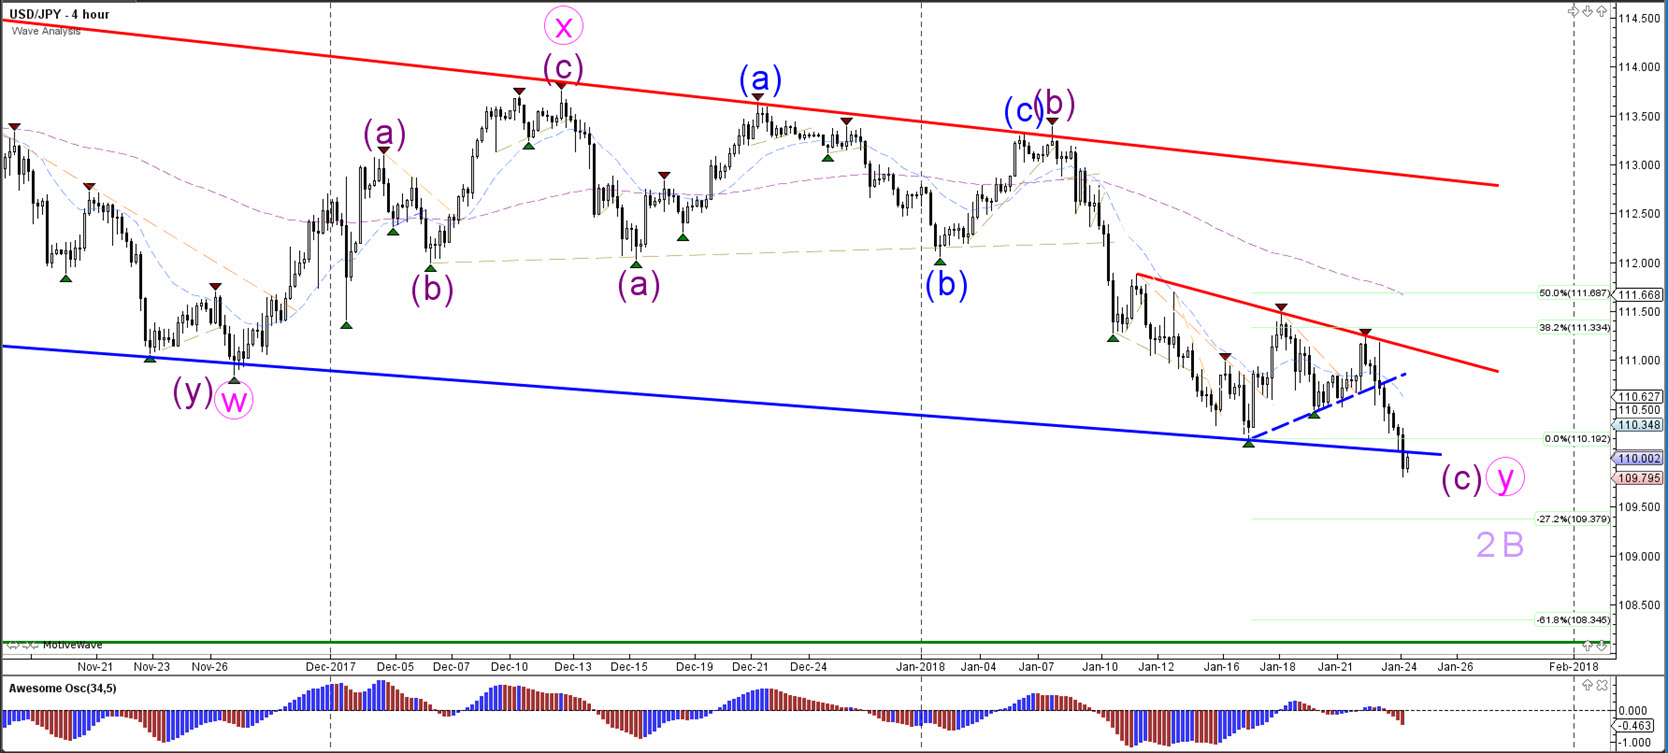
The USD/JPY broke the support trend line (dotted blue) and is continuing with the downtrend, which therefore indicates that the wave 2 or B (light purple) is still open. Price has respected the 38.2-50% Fib zone and could be moving towards the Fibonacci targets.
1 hour
(Click on image to enlarge)
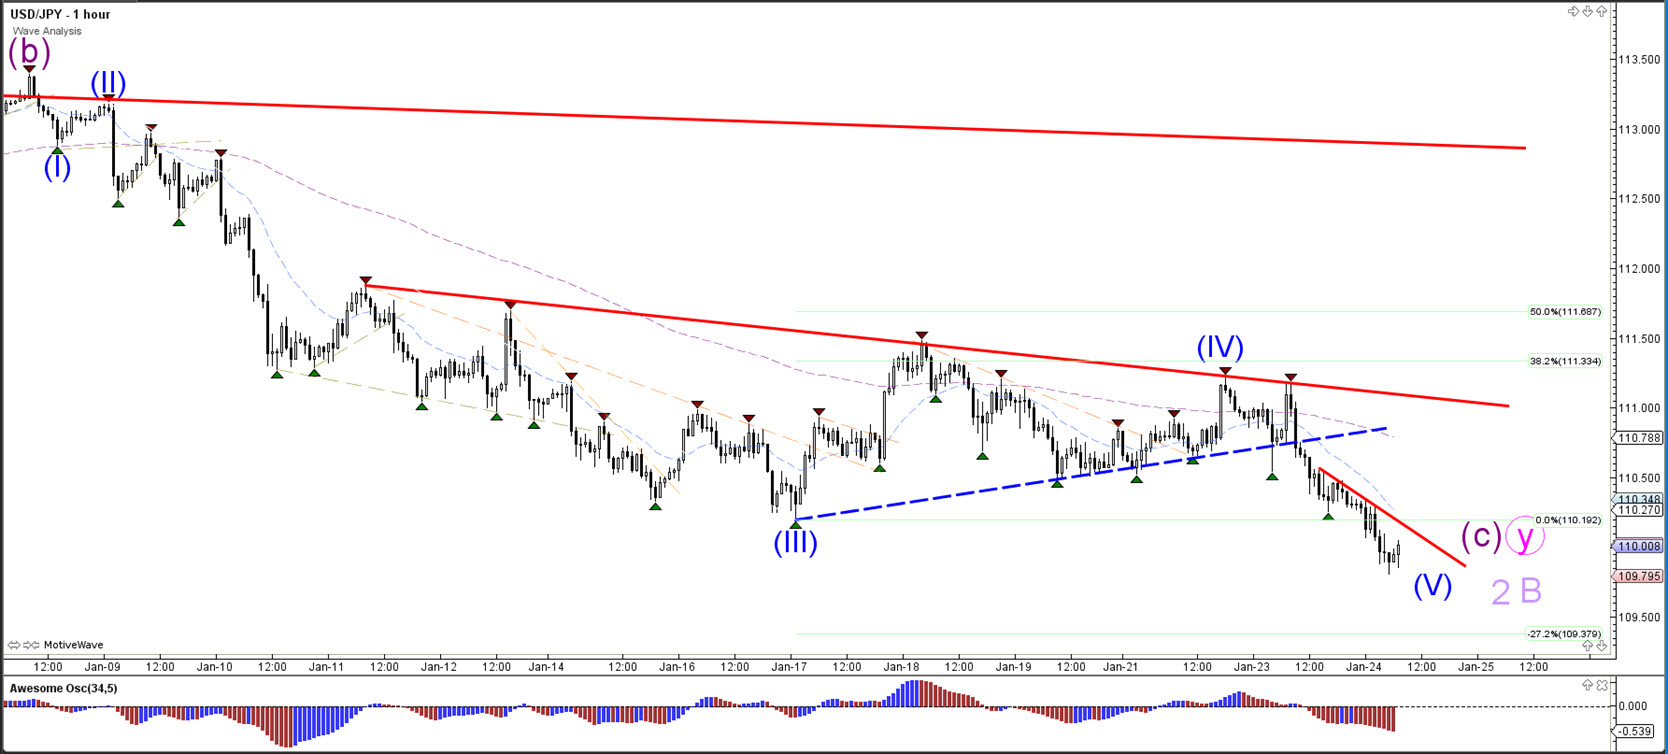
The USD/JPY bearish breakout is probably part of a wave 5 (blue) after completing a lengthy wave 4.



Comments
Log in or sign up to join the conversation.