

US DOLLAR TESTS BELOW SUPPORT AHEAD OF FOMC WEEK
The big item on this week’s economic calendar is the Wednesday rate decision at the Federal Reserve, but that’s not the only release of importance on the docket ahead: Central Banks in the UK and Switzerland speak to markets for their respective rate decisions on Thursday, and on the data-front, inflation figures are set to be released out of the UK, Japan and Canada.
DAILYFX ECONOMIC CALENDAR: HIGH-IMPACT FOR THE WEEK OF MARCH 18, 2019
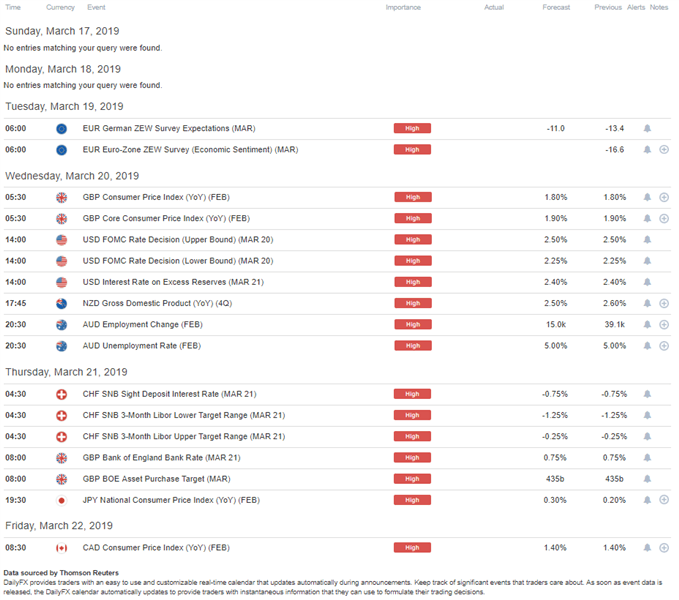
Chart prepared by James Stanley
US DOLLAR RE-TESTS KEY FIBONACCI SUPPORT AT 96.47
The week-long drop in the US Dollar has continued as the currency maintains a pullback below an aggressively sloped trend-line. This pullback began after a big level of resistance came into play just ahead of the March Non-Farm Payrolls report. That level is at 97.71, and this is the same price that had turned-around bullish advances in both November and December of last year, marking the one-year-high in the currency.
The pace with which prices have moved down has thus far been impressive; and there are a couple of areas of interest for support just below current prices, around 96.30 and again around 96.03.
US DOLLAR TWO-HOUR PRICE CHART
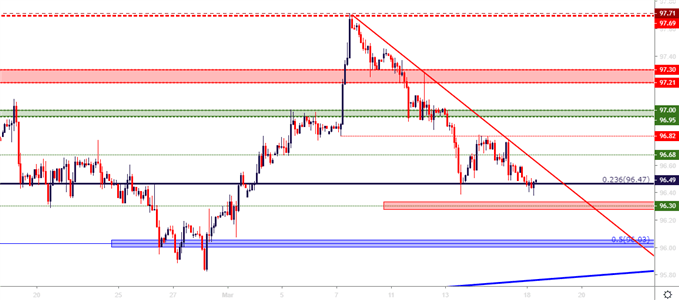
Chart prepared by James Stanley
On a longer-term basis, the big question is whether a bigger-picture bullish response might show at one of these deeper support levels; keeping in order the bullish trend-line that connects last September’s lows to this January’s swing-lows, making for an ascending triangle formation. Such formations will often be approached in a bullish manner with the anticipation that the enthusiasm that’s brought bulls in at higher-lows will, eventually, carry over to allow for a topside drive through horizontal resistance. With prices heading-lower, the big question is where or when that support might show.
US DOLLAR WEEKLY PRICE CHART
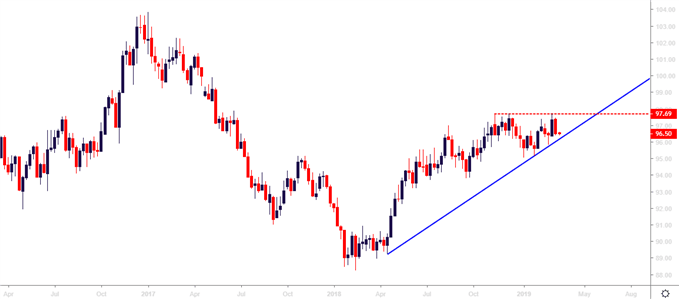
Chart prepared by James Stanley
EURUSD RALLY CONTINUES DESPITE FRIDAY SHAKE
Helping with that short-side move in USD is a continued bullish push in EURUSD. As looked at on Friday, that bullish trend began to pull back to the 1.1300 area; but buyers were sitting on the bid and prices soon pushed-higher. That strength has continued into this week and prices are now testing above the 1.1350-area, keeping the door open for a move back to longer-term resistance around 1.1448-1.1500.
Before that comes into play, however, the 1.1400-zone may elicit some turbulence. This is where prices caught resistance in late-February and early-March, just ahead of the ECB’s announcement of another round of TLTRO’s; which helped to bring a brief breach of support. The NFP report issued the day after helped to bring the US Dollar back down from that big resistance level which allowed for EURUSD to rise back above 1.1200 and then 1.1250.
EUR/USD FOUR-HOUR PRICE CHART
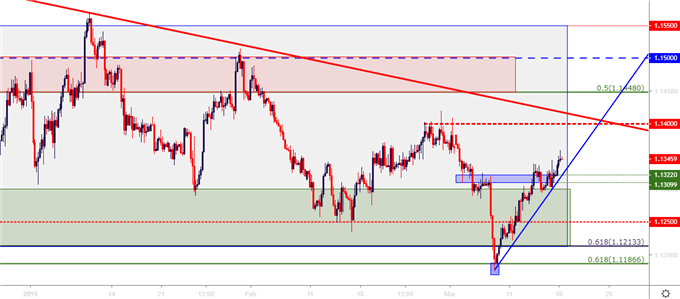
Chart prepared by James Stanley
YEN WEAKNESS REMAINS A DOMINANT THEME
For investors or traders with bullish outlooks on currencies such as the Euro, Pound or even the US Dollar, one currency has stood out for its recent penchant for weakness; allowing for a weak counter-part to mesh up with a potentially strong currency. All of EURJPY, GBPJPY, and USDJPY remain with bullish themes; and there was no sign of abandonment of that theme through last week’s Bank of Japan rate decision.
The bullish side of USDJPY has been one of the bullish-USD setups looked at over the past month in FX Setups of the Week, and the pair is currently staring down the 112-handle that brought in resistance earlier in the month. A topside break through 112.00 brings another potential resistance level into the equation at 112.34. This is the 76.4% Fibonacci retracement of the November 2017- March 2018 major move. This is the same price that helped to set support in November and December, just before the pair began to break-down ahead of the 2019 open.
USD/JPY DAILY PRICE CHART
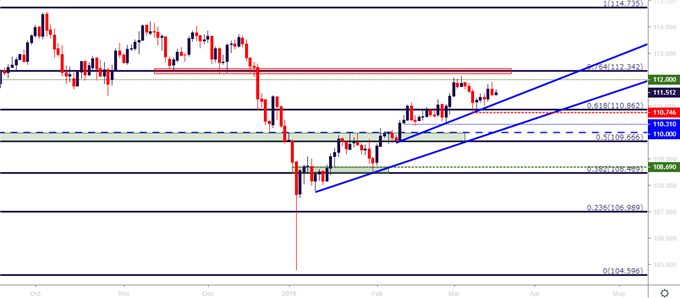
Chart prepared by James Stanley
GOLD MOVES BACK INTO RESISTANCE ZONE
Going along with that continuation of USD-weakness, Gold prices have made a trip back into a key resistance zone while also challenging a bearish trend-line that’s been in-play since before the March open. This comes after last Thursday’s hold of support to create a higher-low, and buyers have remained active since this week’s open. Last week’s swing-high came-in off the 50% marker of the January-February bullish move. A topside break through that price would create a fresh March high while opening the door for a test of the $1320 area on the chart, which is a confluent area with the 14.4% retracement of the August-February move along with the 61.8% Fibonacci retracement of the January-February trend.
GOLD FOUR-HOUR PRICE CHART
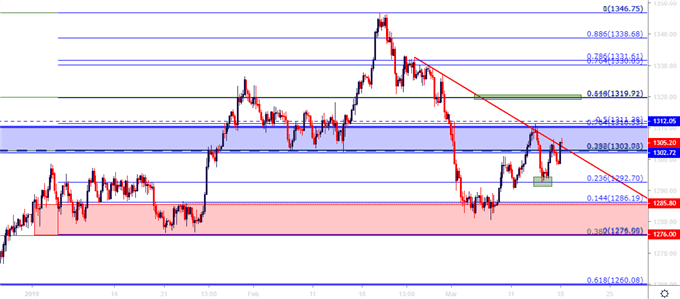
Chart prepared by James Stanley



Comments
Log in or sign up to join the conversation.