
US DOLLAR BOUNCE FROM CONFLUENT SUPPORT RUNS INTO SHORT-TERM RESISTANCE
The US Dollar continues to move higher in an almost begrudging fashion. Last week saw a big area of support come into play when the Dollar collapse ran into a Fibonacci level at 96.47. Also of note was the 200-day moving average in the same area, marking this as a confluent spot on the chart. But, after a quick gap-up to start this week’s trade, buyers have continued to push, bringing prices up to another area on the chart that carries a bit of confluence, albeit of a shorter-term variety, and this runs around the 97.00 level on DXY. This is the May swing-low as well as the 50% retracement of the March-April bullish run in the Greenback; and also the 38.2% retracement of the 2019 major move.
US DOLLAR DAILY PRICE CHART
(Click on image to enlarge)
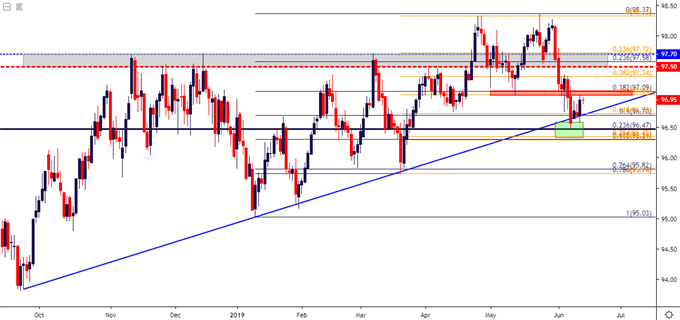
Chart prepared by James Stanley
With retail sales on the calendar for tomorrow and the FOMC rate decision on the docket for next week, the big focus appears to be on whether the Dollar can push through the confluent support that came into play last week. If the US Dollar is able to further breakdown, this brings attention to topside setups in pairs like EURUSD or perhaps even GBPUSD as shorts get further squeezed as a new theme gets priced-in around USD. On the other hand, should recovery continue, bullish potential remains in pairs like USDCAD, or bearish potential in a pair like AUDUSD which has hurriedly pushed back down to the lows as this week’s USD bounce has extended.
AUDUSD PUSH DOWN TO .6900 AS USD HOLDS SUPPORT
Coming into this week, I had looked at the short-side of AUDUSD, largely looking to capitalize on a support bounce in the Greenback but supported by the resistance inflection that had already shown in AUDUSD. The pair has now pushed down through the first target and is finding a bit of support; but this does highlight the potential for another run at the lows after last week’s bounce and ‘rate hike rally’ in the Aussie gets further priced-out.
At this point, traders can look for resistance in the prior support zone that runs from .6940-.6960.
AUDUSD FOUR-HOUR PRICE CHART
(Click on image to enlarge)
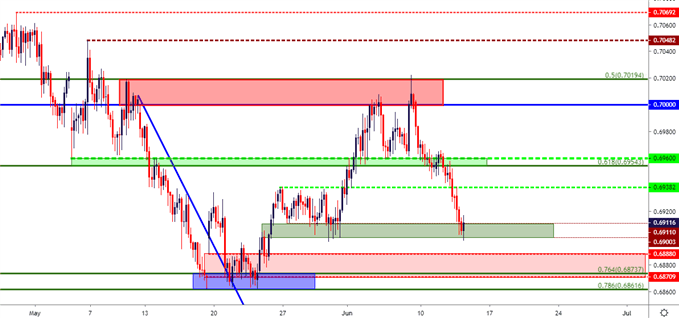
Chart prepared by James Stanley
USDCAD RECOVERS AFTER TEST OF THREE-MONTH-LOWS
Similarly, I looked at topside potential in USDCAD should the pair hold support around the 1.3250 psychological level. And after a quick run on that support after this week’s open, buyers held the bid and prices started to bounce. At this stage, a shorter-term pullback has developed in that bounce, with a bit of short-term support offered around the 1.3300 handle. This can keep the door open for short-term topside trend potential into the zone of prior support that runs from 1.3361-1.3385.
USDCAD TWO-HOUR PRICE CHART
(Click on image to enlarge)
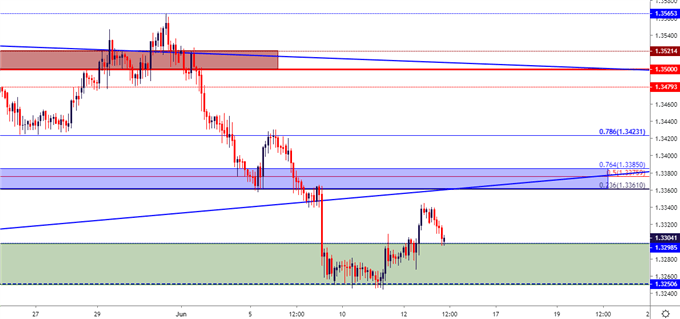
Chart prepared by James Stanley
EURUSD POSTURING ABOVE SUPPORT POTENTIAL
Given the aggressiveness of last week’s USD-weakness, trading for continuation wasn’t expected to be simple. In EURUSD, I had looked at this in this week’s FX Setups, attempting to avoid chasing the move-higher while re-incorporating a prior zone of resistance as potential higher-low support. This zone runs from 1.1248-1.1265 and, hasn’t yet been tested this week. There has been some development of support around the 1.1290-area but that doesn’t look attractive enough to stage bullish approaches off of; particularly considering the fact that stops would be more than 100 pips if looking to get risk levels below last week’s NFP swing-low in EURUSD.
EURUSD EIGHT-HOUR PRICE CHART
(Click on image to enlarge)
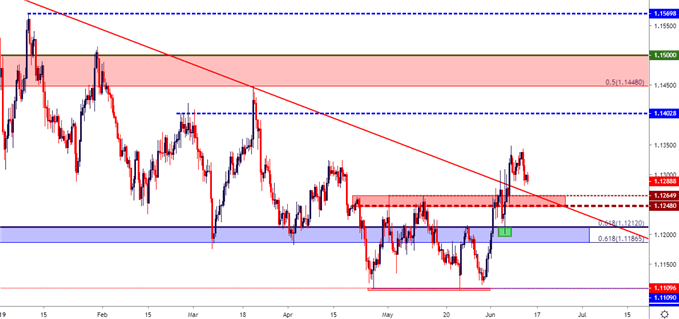
Chart prepared by James Stanley
GBPUSD RANGES IN KEY ZONE
A similar albeit less-developed theme has shown in GBPUSD. The month of May was absolutely brutal for the British Pound, and bears remained in control for much of the period. But, late in the month, a big zone of support came into play that’s rarely been tested, and prices have held the line ever since. The big difference here from the Euro is the fact that the bounce has been far more subdued, thereby making the pair a bit less attractive for USD-weakness themes. But, nonetheless, buyers are holding support despite the fact that they’ve been unable to break-up to a fresh higher-high. If this does take place, however, the door can soon open to topside setups looking for a deeper retracement of May losses. A break-above 1.2763 in GBPUSD can begin to open the door for such scenarios.
GBPUSD FOUR-HOUR PRICE CHART
(Click on image to enlarge)
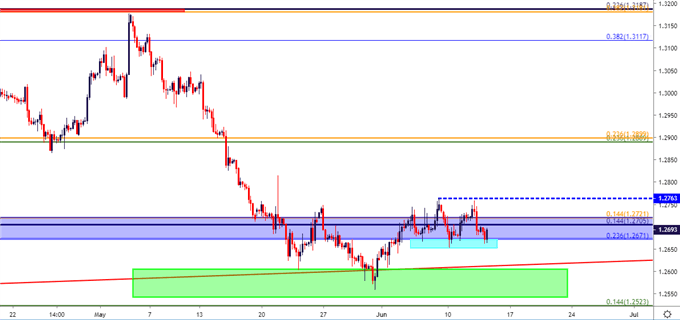
Chart prepared by James Stanley


Comments
Log in or sign up to join the conversation.