
Is this the week that the US Dollar finally breaks out? This was the central question in this week’s Technical Forecast on the US Dollar, and this links with a theme that’s been brewing for the past five months. Prices in the US Dollar have been digesting within an ascending triangle formation. Resistance has held through three different tests in November, December and then again in March after the ECB rate decision. And support has continued to build since September, with the most recent inflection coming-in after the FOMC rate decision last month.
This type of formation will often be approached in a bullish manner, looking for the motivation that’s continued to drive-in bulls at higher-lows to, eventually, take over around resistance to allow a breakout through the horizontal level. This was the focus in the Q2 Technical Forecast for the US Dollar, looking for the topside of that formation to be taken out at some point during the second quarter of this year.
US DOLLAR DAILY PRICE CHART
(Click on image to enlarge)
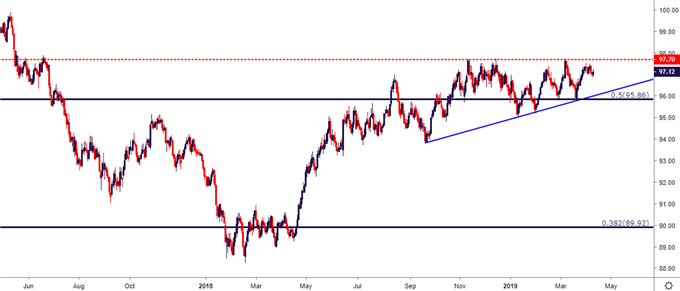
Chart prepared by James Stanley
The big question at this point is whether the backdrop is amenable enough for bulls to pose that push anytime soon. This morning brought a couple of different drivers to the table, each of which served to push the US Dollar higher. The ECB rate decision saw no new announcements, but a bit of dovish commentary from ECB President Mario Draghi helped to push EURUSD back-down towards short-term supports. And the CPI report released out of the US showed Core CPI still at the Fed’s 2% target, and headline CPI came in a touch above expectations, printing at 1.9% versus the 1.8% that was expected. Collectively, this morning’s drivers helped to perk the US Dollar up towards that batch of prior resistance.
US DOLLAR FOUR-HOUR PRICE CHART
(Click on image to enlarge)
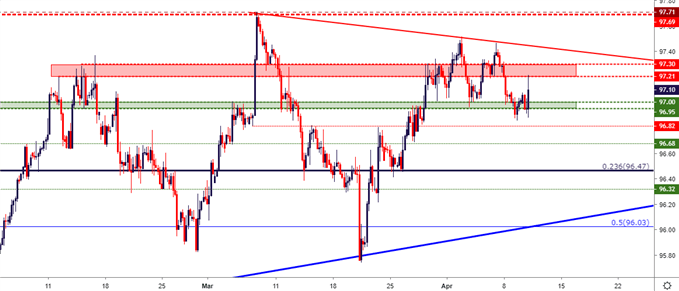
Chart prepared by James Stanley
KEY FOR US DOLLAR TREND THEMES: EURUSD
Given the heavy allocation of the single currency in the composition of the US Dollar, in which the Euro makes up more than 57% of DXY’s composition, and the case can be made that the Dollar likely isn’t going anywhere without the Euro’s agreement. To be sure, the theme of digestion in the US Dollar relates very well to a similar theme in EURUSD, in which prices have been range-bound for the past five months. Making matters even more interesting – this range has held through a variety of both positive and negative drivers.
Of recent, the support side of that formation has come under attack. But, to date, bears haven’t been able to make much ground as buyers have continued to thwart their efforts around two key Fibonacci levels on the chart. At the price of 1.1212 is the 61.8% retracement of the ‘lifetime move’ in EURUSD; and a bit-lower, around 1.1187 is the 61.8% marker of the 2017-2018 bullish move. This zone was a key part of the backdrop in EURUSD for FX Setups of the Week, and thus far this area has held the lows into this morning’s ECB rate decision.
EURUSD TWO-HOUR PRICE CHART
(Click on image to enlarge)
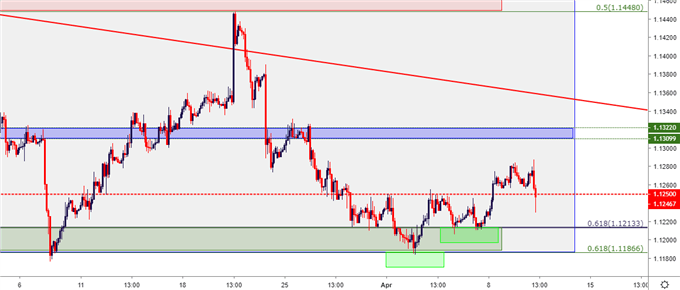
Chart prepared by James Stanley
If the US Dollar is going to post a bullish breakout beyond the 97.71 level that’s functioning as the yearly high, a downside break in EURUSD below 1.1175 will likely need to take place, as well. The big question is, again, whether the backdrop is supportive of such a theme from a timing perspective. In relevance to today’s FOMC meeting minutes, this would likely need to contain a considerably more-hawkish outlook than what is being expected across capital markets, where there has even been a growing chorus of calls for the next FOMC move to be a rate cut as opposed to a hike.
EURUSD DAILY PRICE CHART
(Click on image to enlarge)
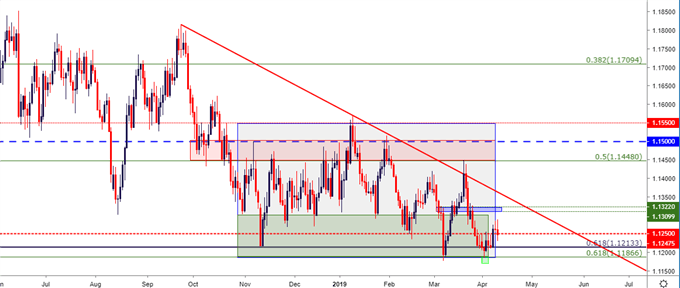
Chart prepared by James Stanley
FOR STRATEGIES OF USD-WEAKNESS, A MORE DOVISH FED: GOLD
If the US Dollar is to continue showing trepidation around those yearly highs, and if there is a brewing bearish theme in the currency, Gold prices can remain as attractive.
As looked at yesterday in the Gold Price Outlook, support has built in around two key Fibonacci levels running from the approximate 1275-1286. This zone of price action has already held up three different tests from January to April; and if the US Dollar is going to show tendencies of breakdown, bullish breakouts and a continuation of strength in Gold prices could remain as an attractive theme.
GOLD PRICE EIGHT-HOUR PRICE CHART
(Click on image to enlarge)
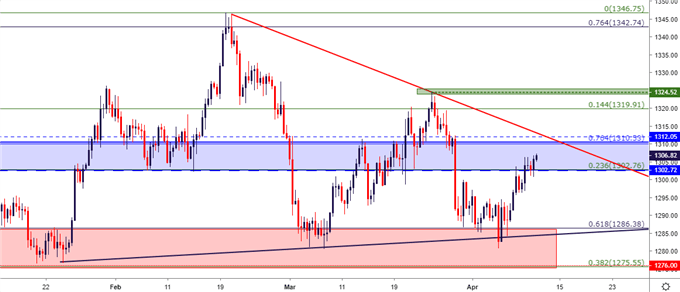
Chart prepared by James Stanley
Taking a step back, and Gold prices are in a similar pattern of digestion, albeit shorter-term than that of the US Dollar. That longer-term support goes along with a series of lower-highs in Gold prices, and this can make for a difficult spot to establish exposure, particularly for trend or continuation strategies. Traders looking at top-side strategies in Gold prices can look for an initial test beyond trend-line resistance, which comes in around the 1314 level, at which point higher-low support can be sought out. Given the prior support/current resistance zone that runs from 1302-1310, that could be an area of interest to re-purpose in the event of a bullish backdrop.
GOLD PRICE DAILY PRICE CHART
(Click on image to enlarge)
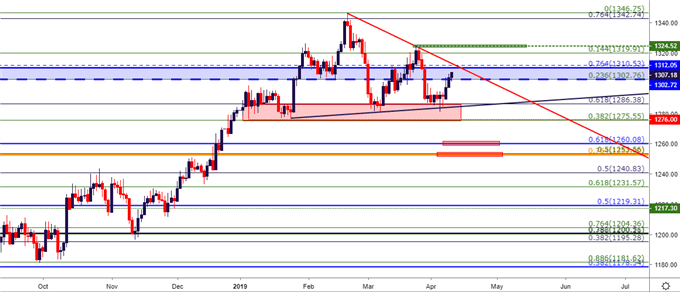
Chart prepared by James Stanley


Comments
Log in or sign up to join the conversation.