

US EQUITY SLUMP CONTINUES
The big item over the past 24 hours is another bearish move in US equities. Yesterday’s late-session sell-off reversed the entirety of Monday’s gains, and the sell-off ran all the way until the 76.4% Fibonacci retracement of the February-March move came into play around 2594. This was the same zone of prices that had helped to set support on Friday, which led into the Monday rally. The big question at this point is whether this support can hold as we move towards the end of Q1.
S&P 500 FOUR-HOUR CHART: FIBONACCI SUPPORT CATCHES THE LOWS
(Click on image to enlarge)
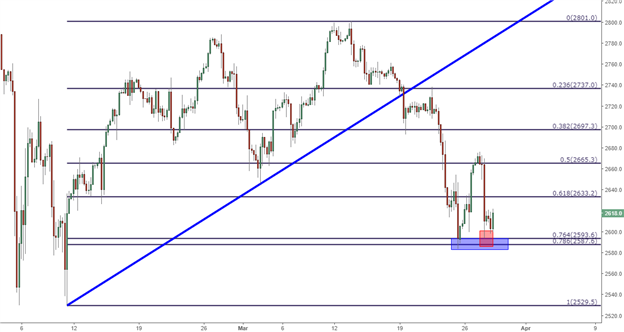
Chart prepared by James Stanley
FACEBOOK SELL-OFF RISKS CHANNEL BREAK
The big item in the headline that’s being attributed to this equity sell-off is the carnage that’s been showing in FANG stocks. That’s Facebook, Amazon, Netflix and Google; with the sell-off being led by Facebook around privacy concerns, and this is also hitting Google’s stock as prices have pulled back to test the psychological $1,000 level. This week’s price action has brought a rather aggressive bearish response, and at this point FB is risking a close below a trend-line that’s never been broken. This can be found by connecting the August 2015 low to the January 2017 low. This trend-line runs parallel to a couple of others that help to compose a channel, but with Facebook’s down-side break, if confirmed by a weekly close below this area - the door is opened to considerably more selling.
FACEBOOK (FB) WEEKLY CHART: TESTING SUPPORT SIDE OF LONG-TERM BULLISH CHANNEL
(Click on image to enlarge)
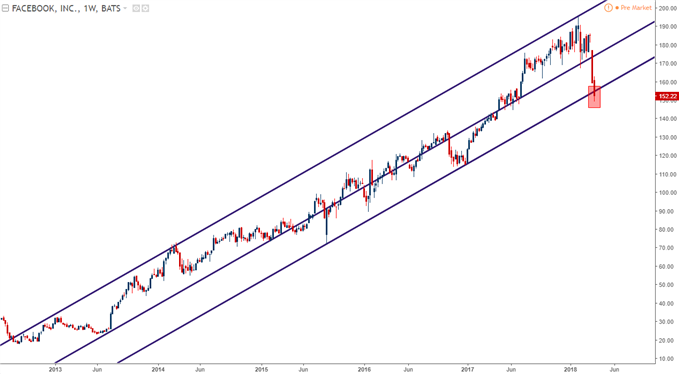
Chart prepared by James Stanley
DOLLAR BULLS TAKE THEIR SHOT
For all the excitement in the equity space, currencies have been relatively benign over the past 24 hours. Yesterday, we had looked at the US Dollar testing resistance at a prior area of support, right around the previous March lows. That resistance held through the US session and through most of Asia, at which point a higher-low began to show as prices moved back into that zone.
US DOLLAR VIA ‘DXY’ HOURLY CHART: DOLLAR BULLS BRING HIGHER-LOW, RETURN TO RESISTANCE ZONE
(Click on image to enlarge)
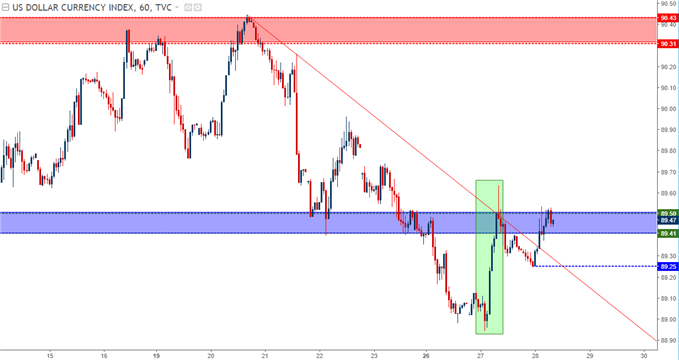
Chart prepared by James Stanley
On a slightly longer-term basis, USD is at a key area that could really cut in either direction. As we looked at above, that higher-low around 89.25 could be the first step of a bullish move. If we do get a higher-high above Friday’s high of 89.73, the door remains open for continued topside in this shorter-term move as we trade towards the end of Q1. But, at this point, the four-hour chart is still showing that lower-high potential and this will be the case until 89.73 gets taken-out.
US DOLLAR VIA ‘DXY’ FOUR-HOUR CHART: BEARISH POTENTIAL REMAINS WITH LOWER-LOWS, HIGHS
(Click on image to enlarge)
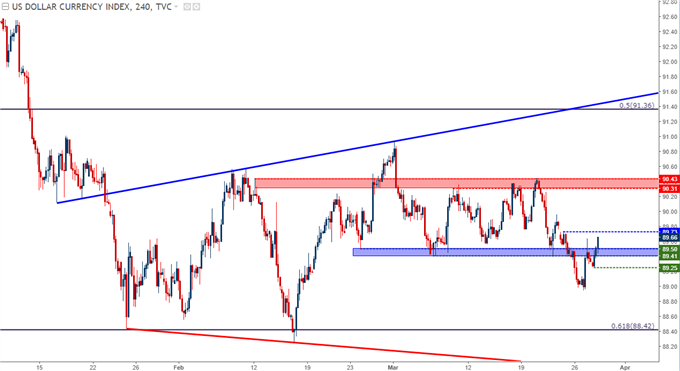
Chart prepared by James Stanley
EUR/USD HANGS NEAR 1.2400
In yesterday’s article we looked at a couple of different areas of interest around EUR/USD, the first of which was a zone of resistance taken from a couple of swing highs earlier in March, spanning from 1.2413 up to 1.2446. This area helped to catch the highs of Monday’s rally, and since then buyers have been unable to make much ground.
But the pullback in the pair, at this point, has been rather mild as we’ve seen support come-in around 1.2375. A bit lower is another area of interest in the zone that spans from 1.2335-1.2350. This area has offered multiple instances of both support and resistance over the past couple of months, and this zone is currently confluent given that we now have a descending trend-line projecting in this region. If we can see that short-term theme of EUR/USD weakness move down to find support in this longer-term zone, the door is open for bullish continuation in the pair.
EUR/USD FOUR-HOUR CHART: BULLISH BREAKOUT STALLS SHY OF 1.2500, HIGHER-LOW SUPPORT POTENTIAL
(Click on image to enlarge)
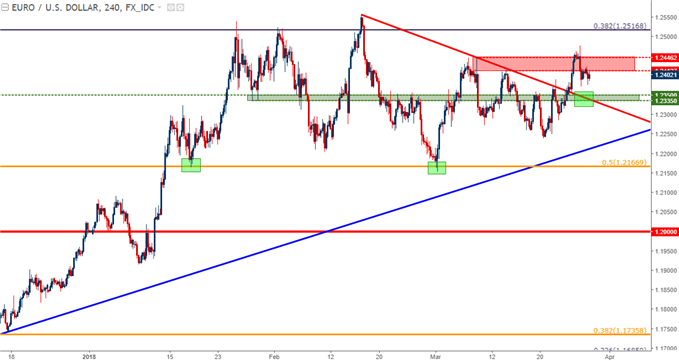
Chart prepared by James Stanley
USD/JPY APPROACHES RESISTANCE ZONE
We discussed this pair at length in yesterday’s webinar, looking deeper into the bearish trend that’s started to show in the pair throughout 2018. This led into a bearish breakout below a big zone of long-term support last week, with a test below the 105.00 psychological level.
USD/JPY DAILY CHART: LAST WEEK’S BREAK OF LONG-TERM SUPPORT MET WITH PULLBACK
(Click on image to enlarge)
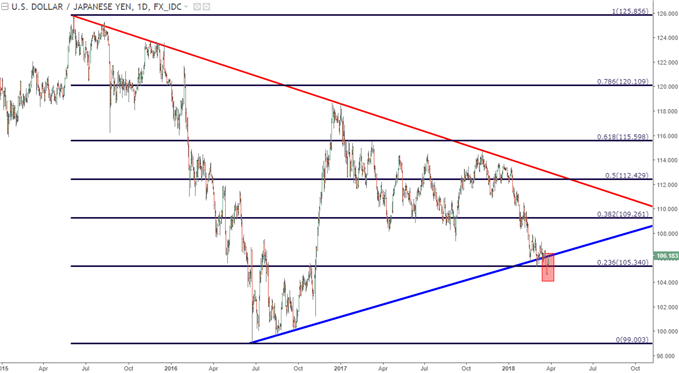
Chart prepared by James Stanley
In yesterday’s webinar, I warned of chasing the pair whilst at these lows, instead focusing on a zone of potential resistance that runs from 106.35 up to 106.61, as this could allow for short-side entry into the setup in a more risk-efficient manner. The bottom of that zone has started to come into play this morning.
USD/JPY FOUR-HOUR CHART, LEAP TO RESISTANCE: WILL SELLERS HOLD THE LOWER-HIGH?
(Click on image to enlarge)
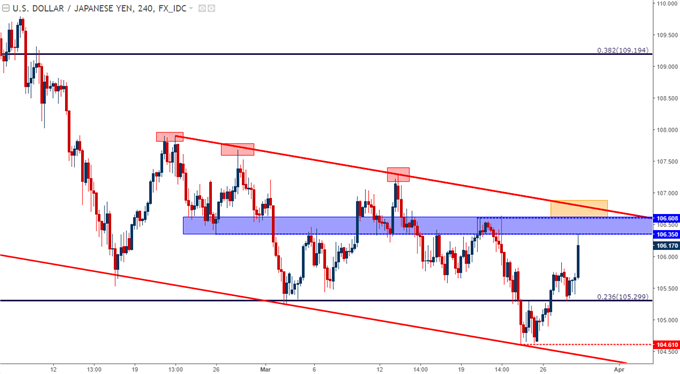
Chart prepared by James Stanley



Comments
Log in or sign up to join the conversation.