

The US Dollar (via the DXY Index) has had a strong week, seemingly weathering several storms en route to becoming the top major performing currency over the past five days. Concerns over Brexit are growing louder and louder, helping keep pressure on an increasingly beleaguered British Pound. Elsewhere, the Euro is struggling as political risks creep up in France (ongoing “giles jaunes” protests) and Spain (where the EU-friendly government has fallen and is now calling for snap elections).
TRADE WAR NEGOTIATIONS ARE A FLAT CIRCLE
At this point, writing about the US-China trade negotiations has been an exercise of repetition. The US-China trade negotiations have been and still, are on a rinse-and-repeat cycle for the past year. As we’ve discussed, the cycle goes: (1) Trump administration is tough on China; (2) financial markets sell off on trade war concerns; (3) Trump administration hints at US-China trade deal; (4) financial markets rally on trade deal hopes; (5) No deal materializes.
Just yesterday we said that “We’re back to stage 5, with the new impasse. In the next few days, downtrodden rhetoric from the Trump administration should morph to something more hopeful.” How quickly that tone changed, with the sixth round of negotiations ending and both American and Chinese negotiators agreeing to a Memorandum of Understanding (MOU) that will pave the way for a Trump-Xi summit in the next few weeks.
TRADE WAR NOT OVER YET
However, as of this time, this is still no new information regarding the imposition of tariffs on March 2. A 25% tariff on $200 billion of imported Chinese goods would go into effect should no new US-China trade deal be reached by that time. So, while the MOU is a step in the right direction (risk positive), for all traders know, the MOU could be a set of empty promises that just kicks the can down the road (risk negative).
GOLD PRICE CHART: DAILY TIMEFRAME (DECEMBER 2017 TO FEBRUARY 2019) (CHART 1)
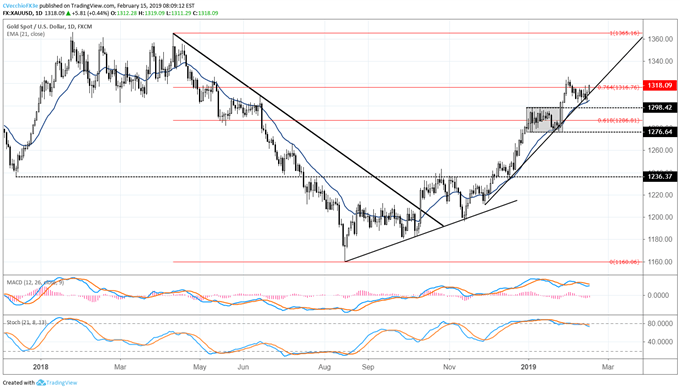
After hitting its daily 21-EMA for the first time since January 25 – trend support on every close since November 28 – Gold prices have rallied meaningfully over the past 24-hours. Such price action as we make our way through mid-February suggests that recent losses have been corrective in nature rather than an indication of a trend change. For the bull trend to restart, Gold prices will need to clear out Wednesday’s inverted hammer high at 1318.02 – something that was underway at the time of writing.
DXY INDEX PRICE CHART: DAILY TIMEFRAME (JUNE 2018 TO FEBRUARY 2019) (CHART 2)
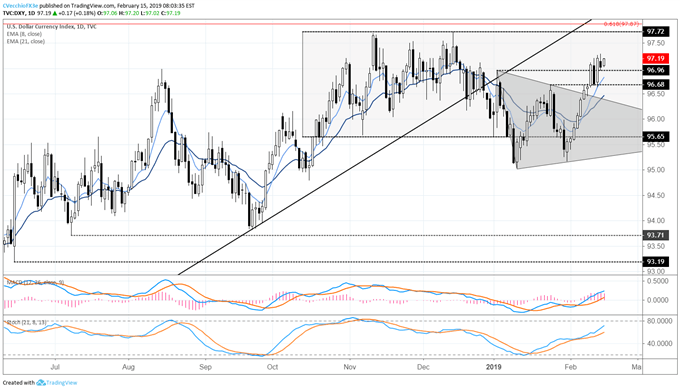
Despite the inverted hammer that formed on the daily chart, it’s difficult to view the DXY Index as anything other than bullish in the short-term. Following the symmetrical triangle breakout, the price has cleared the January 2019 swing high at 96.96, pushing to a fresh yearly high every day this week but for today. Recal on Wednesday that the bullish outside engulfing bar that formed came after the first retest of the daily 8-EMA since February 5. With price still above its daily 8-, 13-, and 21-EMA envelope, and with both daily MACD and Slow Stochastics rising through the bullish territory, our outlook still looks for “an ultimate return back to the October 2018-January 2019 range highs near 97.72.”



Comments
Log in or sign up to join the conversation.