
S&P 500 REVERSES AFTER KUDLOW COMMENTS ON TARIFFS
It’s been a busy 24 hours across financial markets, with a key driver showing up in yesterday’s morning’s US session. As global stocks were starting to take on a worrying overtone, with the S&P 500 appearing very near a re-test of the February double-bottom, White House Chief Economic Advisor Larry Kudlow offered some comments to Bloomberg News that seemed to be crafted specifically for traders’ ears. Mr. Kudlow framed tariff talk as more of a negotiations rather than a done deal, reminding that ‘none of the tariffs have been put in place yet,’ and that it would likely take up to two months to actually begin implementation.
This was music to markets’ ears and US equities quickly started a rally that lasted into this morning’s European open. A bit of resistance has started to show in S&P 500 futures, and this is coming-in at the 38.2% Fibonacci retracement of the February sell-off. Bulls have appeared to be rather undeterred after this resistance test, as we’ve seen a build of higher-low support since that level came into play earlier this morning.
S&P 500 TWO-HOUR CHART: BULLISH REVERSAL RUNS INTO FIBONACCI RESISTANCE
(Click on image to enlarge)
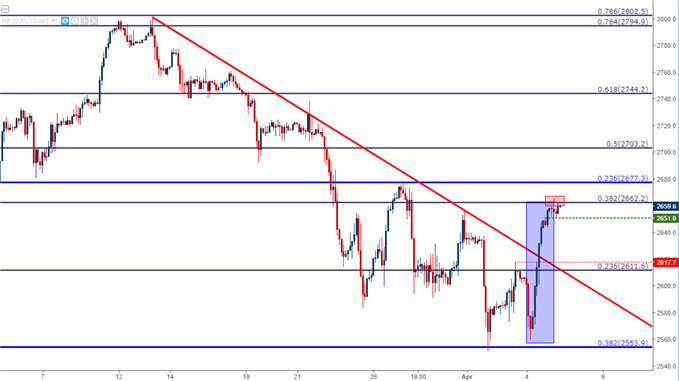
Chart prepared by James Stanley
NFP, CANADIAN JOBS NUMBERS ON DECK; POWELL SPEECH AHEAD OF US MARKET CLOSE
Tomorrow’s economic calendar brings Non-Farm Payrolls out of the United States, and we’re also getting Canadian Jobs numbers at the same time; making for an especially pensive backdrop in USD/CAD.
But that’s not all that this Friday holds, as we’re also going to get a speech from Fed Chair, Jerome Powell, at 1:30 PM ET. While it may be hard to imagine how a speech from a Fed Chair a few hours ahead of markets closing for the week may not work out well for stocks, it’s important to note that after each of Mr. Powell’s appearances in March, a degree of risk aversion began to show. Earlier in the month at Humphrey Hawkins, stocks took on a fairly nasty tone after his first day of speaking and largely remained until he finished a couple of days later. And then we had the rate hike later in the month, and that was followed by another rather nasty spill in US equities. So – traders may want to be a bit more balanced as we go into that speech than if this were Janet Yellen.
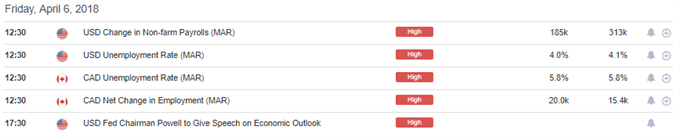
DAILYFX ECONOMIC CALENDAR: HIGH-IMPACT EVENTS FOR FRIDAY APRIL 6TH, 2018
(Click on image to enlarge)
prepared by James Stanley
US DOLLAR HOLDS 90.00 SUPPORT, FRESH TWO-WEEK HIGHS
The US Dollar is continuing to hold on to support above the 90.00 level, threatening a deeper move of strength after what’s been a tumultuous past 12 months. With Non-Farm Payrolls on the docket for tomorrow, the range of possible outcomes here widens significantly. The expectation for tomorrow’s print is for +188k jobs to have been added to American Non-Farm Payrolls in the month of March. As always, we’ll also get revisions on data from the prior two releases, and as we’ve seen over the past few months - focus will heavily centered around wage gains via Average Hourly Earnings.
US DOLLAR VIA ‘DXY’ FOUR-HOUR CHART: SUPPORT AT 90.00 HOLDS, DXY TRADES UP TO TWO-WEEK HIGHS
(Click on image to enlarge)
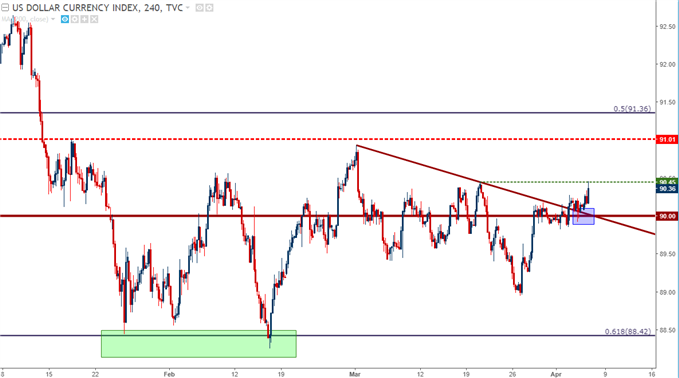
Chart prepared by James Stanley
EUR/USD BEGINS TEST OF 2017 BULLISH TREND-LINE; WILL BULLS BE ABLE TO HOLD SUPPORT?
Going along with this move of USD-strength has been a deeper pullback in EUR/USD, and earlier this morning, price action ran into the bullish trend-line that had held in the pair for much of last year. This projects to around 1.2255 currently, and we’ve already seen a couple of different tests since the Euro open.
EUR/USD DAILY CHART: TEST OF 2017 BULLISH TREND-LINE UNDERWAY
(Click on image to enlarge)
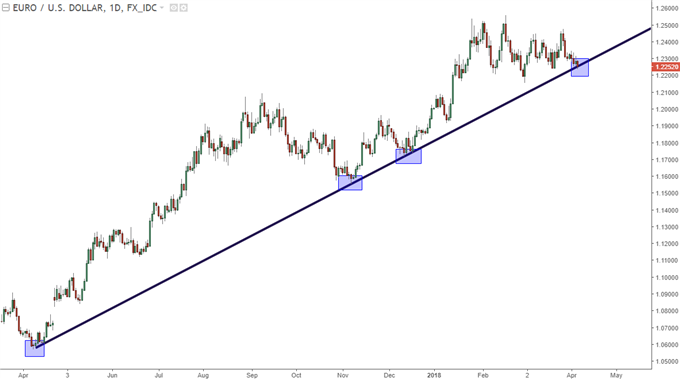
Chart prepared by James Stanley
On the four-hour chart below, we can focus-in on the grind taking place at this support level. This trend-line first started to come into play around the European open, and has held a couple of different tests already on the early part of the day. A quick breach no more than an hour ago caught some secondary support off of the March swing-low at 1.2237, and prices have since moved back above that trend-line projection, indicating continued support around this key area on the chart.
EUR/USD FOUR-HOUR CHART: SHORT-TERM BEARISH DRIVE RUNS INTO LONGER-TERM BULLISH TREND-LINE
(Click on image to enlarge)
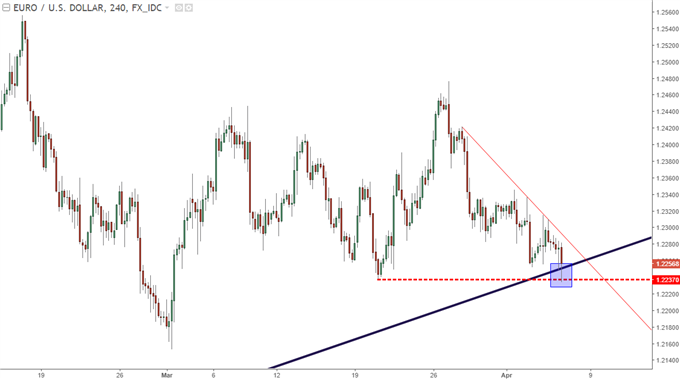
Chart prepared by James Stanley
USD/JPY BREAKS CHANNEL RESISTANCE
We looked at USD/JPY putting in yet another test of channel resistance yesterday morning, but as we warned, a set of higher lows that had shown after a very bullish start to the week made the prospect of short-side continuation a bit more suspect. That theme of strength has continued as the pair is now trading above the 107.00 figure, and prices are fast approaching the March high at 107.29.
USD/JPY FOUR-HOUR CHART: BULLISH BREAK OF BEARISH CHANNEL
(Click on image to enlarge)
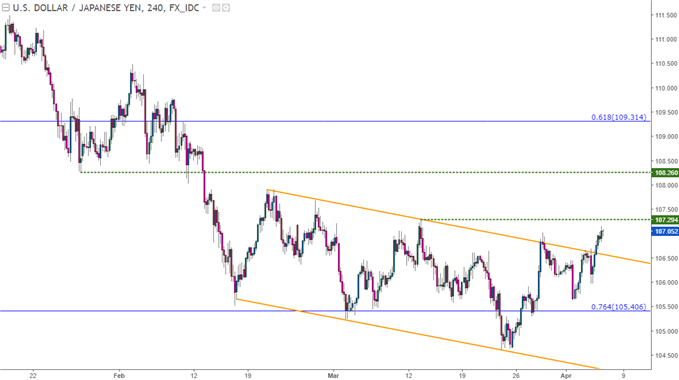
Chart prepared by James Stanley
GBP/USD BACK DOWN TO 1.4000
We looked into GBP/USD yesterday, as the pair was displaying bullish longer-term indications while short-term price action was rather messy. As we warned, short-term resistance showing at prior support made the prospect of topside trend continuation less attractive, and we focused-in on a zone of possible support that runs from 1.3982-1.4000. Prices are now testing the 1.4000 figure, and the big question is whether or not bulls show up before we take out the March 20th low.
GBP/USD FOUR-HOUR CHART: TESTING 1.4000 AGAIN, WILL BULLS BE ABLE TO HOLD THE LINE?
(Click on image to enlarge)
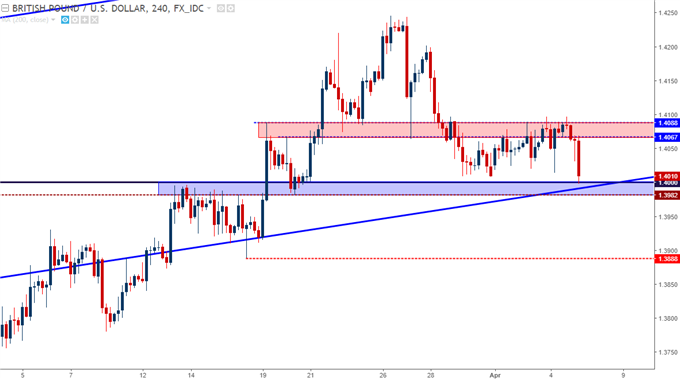
Chart prepared by James Stanley


Comments
Log in or sign up to join the conversation.