
EUR/USD
4 hour
(Click on image to enlarge)

Important data is being announced in the US today. The NFP figures and the unemployment rate will indicate how well the employment market is doing in the current economic environment.
EUR/USD is still building a bullish retracement within wave 4 (blue). A break below the support of the sideways zone (green) could indicate the continuation of the wave 5 (blue) within a larger wave C (purple). A break above the 61.8% Fib makes a wave 4 (blue) less likely.
1 hour
(Click on image to enlarge)

The EUR/USD will most likely complete the wave 4 (blue) if price breaks below the channel (blue). In the meantime, price could retrace to deeper Fibonacci levels of wave 4 (blue) but typically should not break above the 61.8% Fibonacci level.
GBP/USD
4 hour
(Click on image to enlarge)

The GBP/USD broke the support trendlines (dotted blue) after strong bearish momentum occurred during the Bank of England rate decision. The bearish turn makes the wave 4 (green) correction more likely now and a wave 5 (green) breakout could occur soon or later this month.
1 hour
(Click on image to enlarge)

The GBP/USD is showing strong bearish momentum and could be in a wave 4 (blue) of a larger wave 3 (orange).
USD/JPY
4 hour
(Click on image to enlarge)
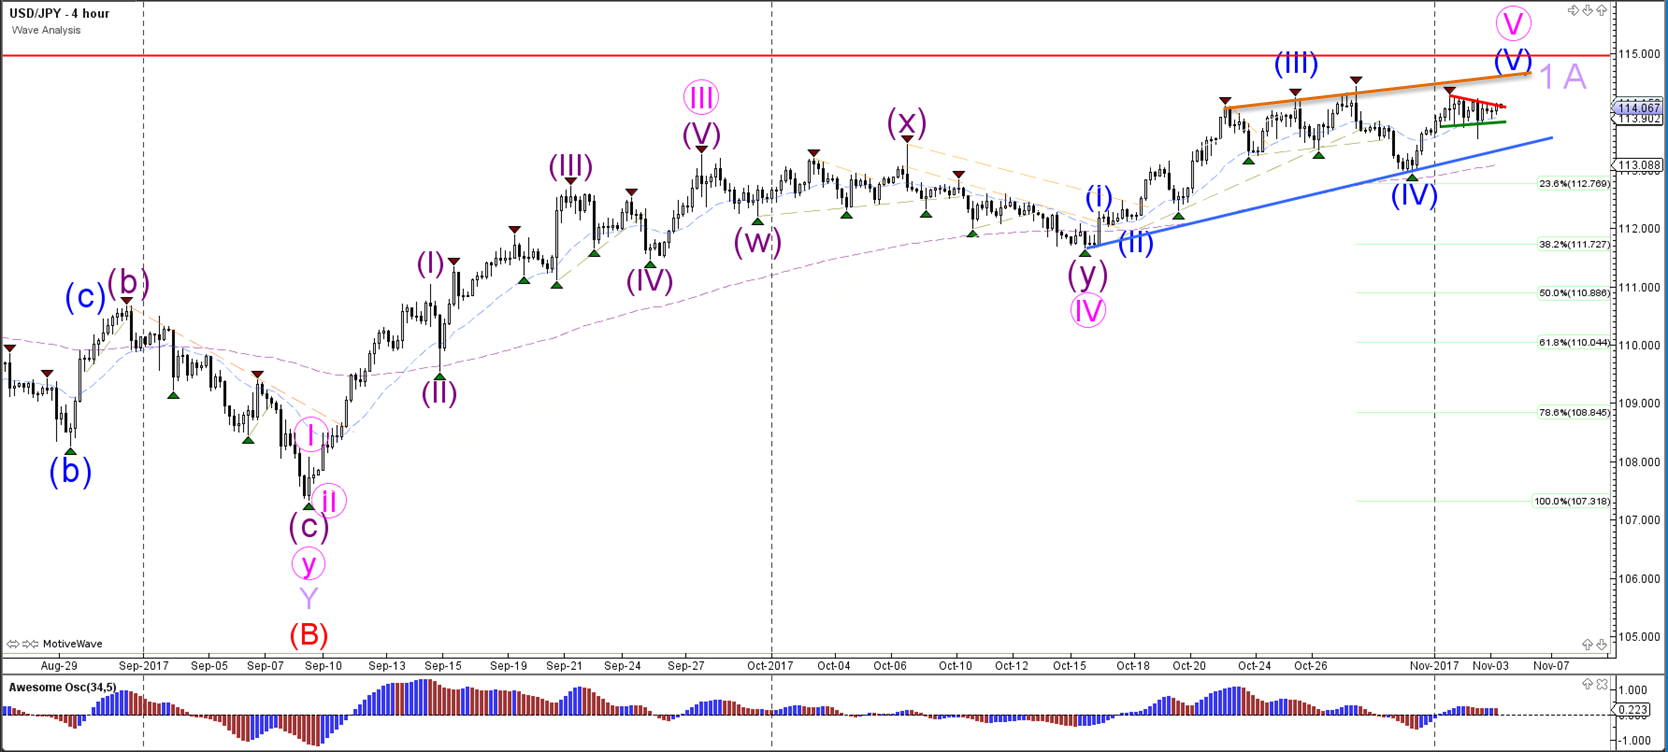
The USD/JPY sideways pattern is most likely indicating that one more bullish push is likely towards the 115-resistance level.
1 hour
(Click on image to enlarge)

The USD/JPY needs to break above the resistance trend line (red) to continue towards the Fibonacci targets at 114.50-115.


Comments
Log in or sign up to join the conversation.