

Talking Points:
- US Dollar bulls continue to push and prices have made a move back to the long-term resistance that exists from 94.19-94.30 in DXY. While there’s something to be said about USD strength showing ahead of a well-anticipated rate hike in a couple of weeks, the more interesting facet of this move is continued weakness in EUR/USD on the back of Italian politics; begging the question – are we on the verge of another European financial crisis?
- Next week’s economic calendar is loaded with USD drivers, and Monday is a holiday in the United States in observance of Memorial Day. We previewed next week in our webinar yesterday, looking at a variety of setups as we move towards the end of May. That video is available directly from the following link: US Dollar Price Action Setups Ahead of a Loaded USD Economic Calendar.
US DOLLAR BACK TO RESISTANCE
Yesterday’s pullback in the US Dollar didn’t last for long, as bulls came back during the Asian session to drive the Dollar right back to the area of resistance that we looked at yesterday. This sets the stage for what could be an eventful week, as next week’s economic calendar is loaded with USD-drivers. Monday is a holiday in observance of Memorial Day in the United States, and after that we have high-impact USD data on the calendar for every day of the week. Two weeks later, we get the June FOMC rate decision, and this should be a big one; not necessarily for the rate hike that markets have likely already priced-in, but to get the Fed’s dot plot matrix to see where the bank is looking to take rates in the second half of the year. Next week’s trove of data will be key in that decision making process, as this will be some of the most recently released indicators around what’s going on inside of the US economy.
Of particular interest for that theme will be Thursday’s release of PCE data, as this is the Fed’s preferred inflation gauge. After that, we get Non-Farm Payrolls next Friday morning on June the first, and this could be climactic given the current backdrop around the US Dollar.
DAILYFX ECONOMIC CALENDAR – HIGH-IMPACT USD ITEMS FOR NEXT WEEK
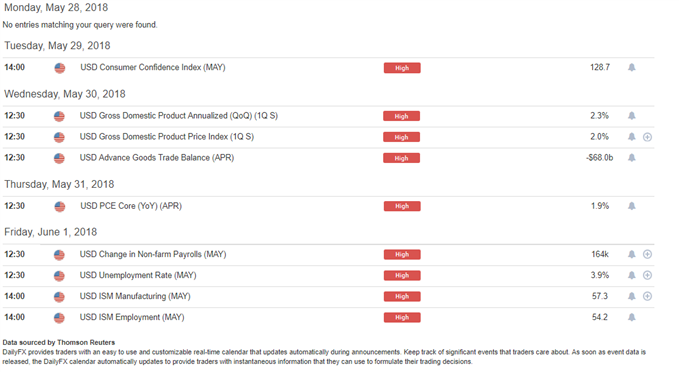
Chart prepared by James Stanley
US DOLLAR TESTS KEY LEVEL AHEAD OF DATA ONSLAUGHT
As mentioned earlier this week, the US Dollar began to interact with an interesting area of resistance over the past few days. This is a confluent zone of Fibonacci resistance that runs from 94.19-94.30, and this is the same area that helped to set monthly swing highs in August, early-October and December of last year. This area contains 38.2% retracements from both the 2014-2017 major move, as well as the retracement inside of that major move that started last year.
US DOLLAR VIA ‘DXY’ DAILY CHART: PAUSE NEAR CONFLUENT RESISTANCE
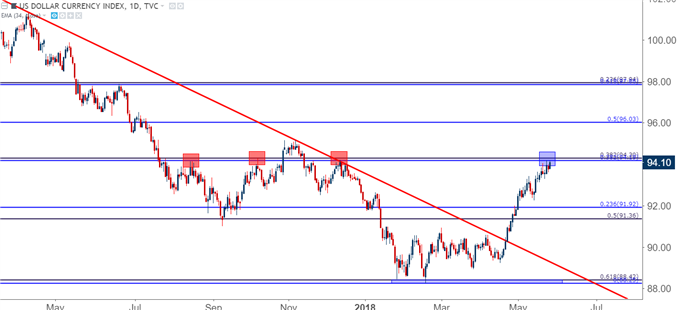
Chart prepared by James Stanley
A break above this area of confluent resistance not only gives us fresh six-month highs, but also the potential for a challenge of the 96.03 level, which is the 50% retracement of the sell-off that started last year. If we do not breakthrough, however, there is still a case to be made for bullish continuation, albeit in a less enthusiastic manner. On the below four-hour chart, we’re looking at the higher lows that have continued to print in DXY, helping to retain this bullish structure even as longer-term resistance began to come into play. Pullbacks towards these levels keeps the door open for topside; while breaks below, including a break back-below 93.00 begins to open the door for short-side setups or reversal strategies.
US DOLLAR HOURLY CHART: BULLISH SHORT-TERM STRUCTURE ABOVE 93.00 ON DXY
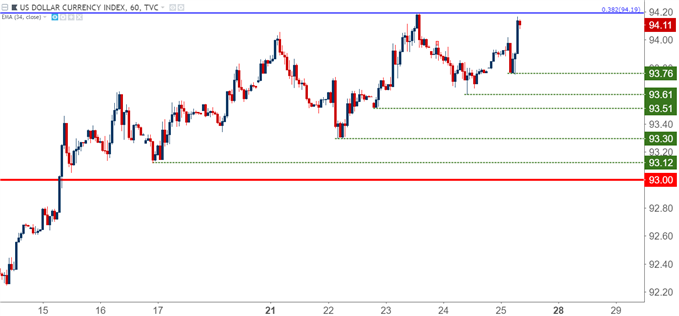
Chart prepared by James Stanley
EUR/USD TO FRESH LOWS AS CRISIS FEARS BEGIN TO FLARE
Are we on the verge of another European Financial Crisis? While that may have sounded an irrelevant if not mistimed question only a year ago as we were wrapping up French elections, events in Italy have brought this back into the spotlight. A separate but related fear of a similar move in Spain has helped to stoke concern around European unification, and given how stretched the ECB’s QE program has become after four years of accommodation, those fears are beginning to show in market prices.
EUR/USD just fell below a big zone of support, and the price action that’s shown in this move hasn’t been very encouraging. Bears remain active and aggressive, punching-lower anytime prices have swung higher. Two weeks ago we looked at a short off of 1.2000; and now we’re approaching 1.1600. That’s a big move in a really short period of time, so at this point we have to acknowledge the fact that something new is or may be getting priced-in here. At this stage, traders should be careful of topside approaches in the pair as it doesn’t look as though the European political picture is going to brighten anytime soon.
This could also make the pair an attractive candidate for playing a continuation of US Dollar strength, particularly if we can see a pullback in this move to offer a better short-side entry.
EUR/USD TO FRESH SIX-MONTH LOWS AS BEARS PUSH BELOW SUPPORT
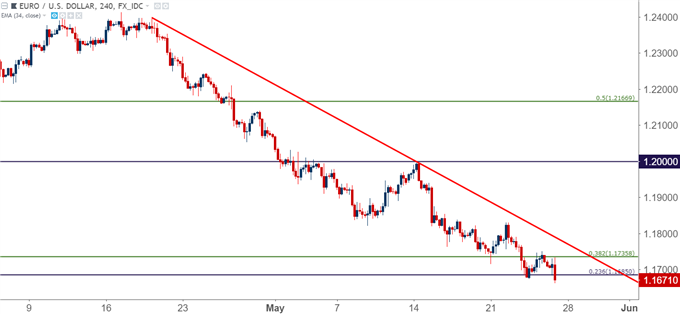
Chart prepared by James Stanley
GBP/USD: CABLE GETS COMFORTABLE AROUND SUPPORT
Surprisingly, EUR/USD looks a bit more bearish than GBP/USD right now, and again, this denotes the fact that something new may be getting priced-in to the Euro. GBP/USD was holding at a key support level coming into this week, breaking-lower when Nicola Sturgeon brought the idea of Scottish independence back to the table. This produced a break below the zone of support around the 1.3500 psychological level, at which point we looked at short-side setups; and prices have now moved down to an interesting area that was relevant in the second half of last year. This area runs from 1.3270 up to 1.3321, and after showing as resistance in August, October and November, bulls came in to give a couple of iterations of support before launching-up to fresh post-Brexit highs. At this stage, we saw support come-in on Wednesday, with a hold on Thursday, and we now have another test on Friday morning.
If prices close above this level, and this area holds through next week’s open, the possibility of bullish reversal setups can begin to get attractive.
GBP/USD DAILY CHART
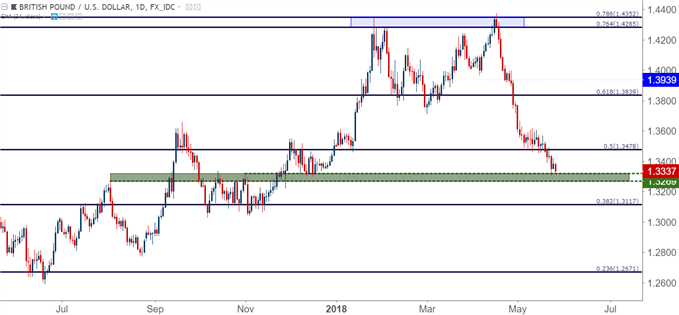
Chart prepared by James Stanley
USD/JPY PULLS BACK TO SUPPORT – BUT WILL IT HOLD?
The support zone that we looked at yesterday in USD/JPY has held, at least so far, and this keeps the door open for bullish continuation. With Yen-strength showing on the back of the US withdrawal from the summit with North Korea, the big question is whether that theme of ‘less positive’ relations between the two countries is priced-in already. Also of relevance, what is the probability for another run of increased tension? Both the US and North Korea sounded rather open to continued discussions, so this may be an instance of markets pricing-in something that ends up being not so relevant. Regardless of the dynamics, USD/JPY finds itself at a familiar support zone as we approach a big week of US data, and this could remain as one of the more attractive long-USD setups.
USD/JPY FOUR-HOUR CHART: PULLBACK TO SUPPORT ZONE
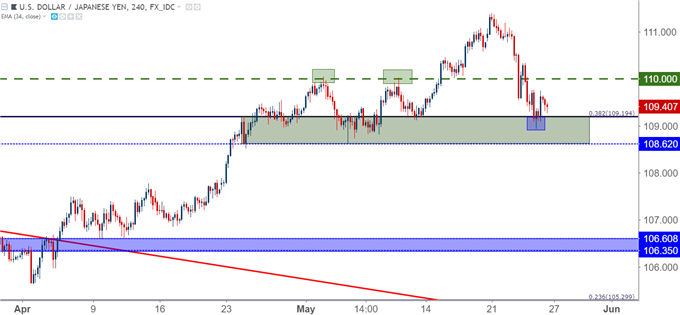
Chart prepared by James Stanley
AUD/USD WITH BULLISH POTENTIAL
Two weeks ago we looked at AUD/USD as one of our favored short-USD candidates, and while that trade almost got stopped out within the first two trading days, bulls returned to push prices higher and the first target has been taken-out. At this stage, the prospect of additional topside remains, as AUD/USD has been moving higher this week even as the US Dollar retained its strength. If we do see a pullback in USD around that area of big picture resistance, this could add a bit of motivation to the topside of AUD/USD, and this exposes resistance in the .7650-.7680 area on the chart.
AUD/USD FOUR-HOUR CHART: BULLISH POTENTIAL, HIGHER-HIGHS AND LOWS EVEN WITH USD-STRENGTH
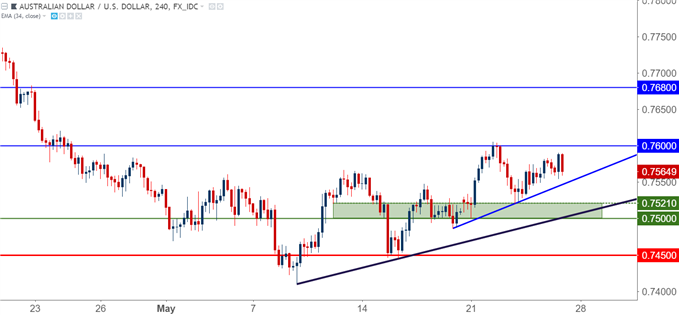
Chart prepared by James Stanley
NZD/USD REMAINS NEAR LONG-TERM RANGE SUPPORT
In mid-April, we looked at the short-side of NZD/USD as a way to get long the US Dollar, and as that pronounced theme of US Dollar strength came-in, NZD/USD folded lower by almost 500 pips in the span of five weeks. This has been a near round-trip from resistance in the multi-year range down to support, and the big question now is one of timing, as prices have been sitting around this support zone now for over a week.
We may have a deeper drive within this area before the bullish side is able to win out; but this range still very much applies until we get a print below .6750 on NZD/USD. If we do see USD breaking-below the 93.00 level next week, this will likely be one of the more attractive candidates to work with, along with AUD/USD, as buyers push prices higher from support.
NZD/USD WEEKLY CHART
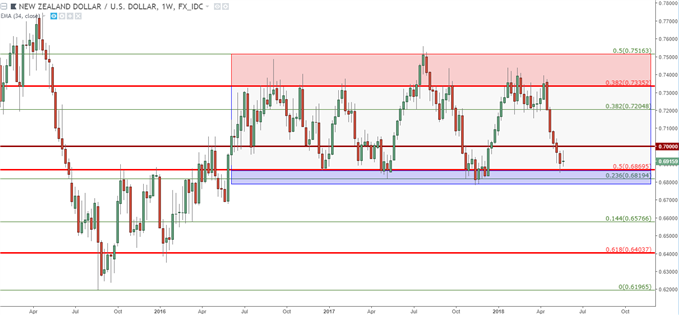
Chart prepared by James Stanley



Comments
Log in or sign up to join the conversation.