

I’m reluctant to make corona predictions in no small part because I am not a big believer in macro models. Nonetheless, there is one trend that I think is revealing: states that peaked early have dropped off in their death rates.
I think this is due to ‘community immunity’. Not perfect immunity, not herd immunity, just a rolling immunity that lowers death rates because even though people might get reinfected they probably have some residual protection that gets ‘reupped.’ My expectation is that community immunity is only realized when there is a relatively short burst of broad infection – as in Sweden or the Ultra Orthodox community of New York.
If the infection rates are kept low then you never achieve this state because the time between infections is too long. Note that I am talking about infections, not diagnosis. Because testing is so variable, the spread between these two can be vast. At the very least, it is often unknown. As we’ve seen from New York’s serological survey’s, the number of undiagnosed cases can be quite high.
The Early Peak States
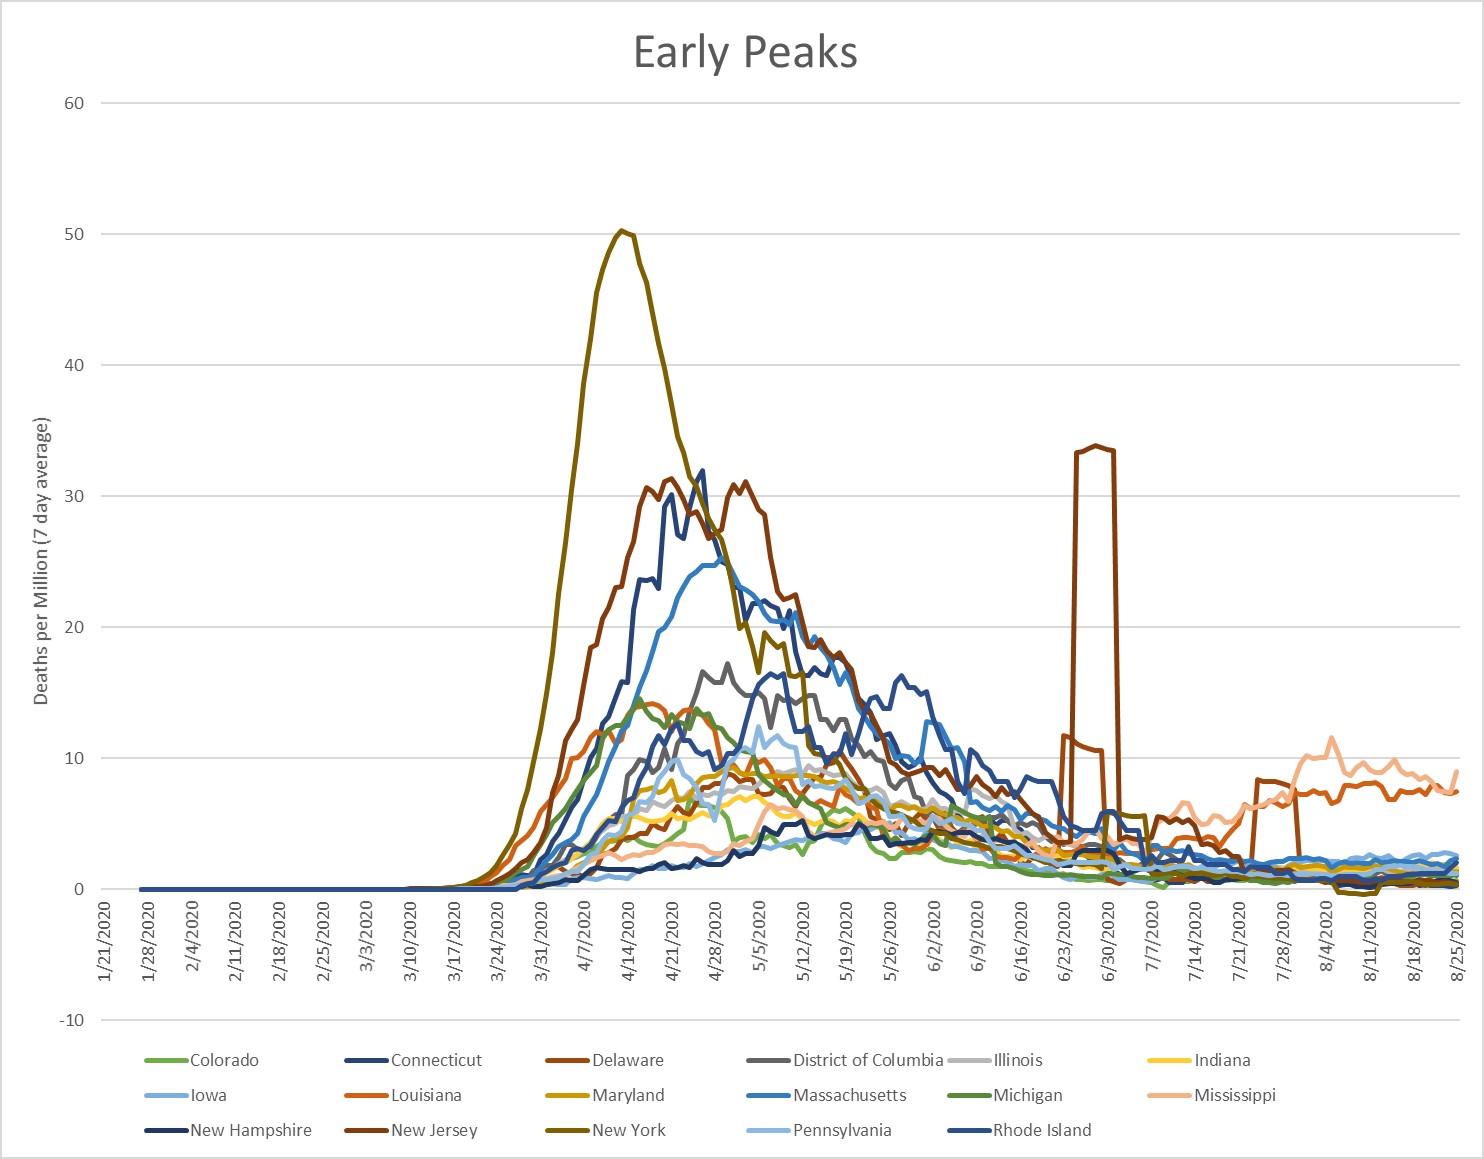
The states that follow the ‘community immunity’ model would seem to include all those with a peak of over 5 deaths/million/day prior to July 1. Six of these states peaked at over 15 deaths/million/day. New York hit 50. The big later humps for New Jersey and Delaware are deaths added in after the fact to correct for earlier data errors.
I predict these states will hover somewhere at or below 2 deaths/million/day until there is a vaccine.
Louisiana and Mississippi are the exceptions to this rule. According to US News, Mississippi is dead last in quality of medical care and Louisiana is 45th. It is possible the death rate from their first peak was an artifact of medical care, not broad infection. This, combined with the relatively low initial peaks that they experienced, suggests that they may never have experienced the broad infection rates of the rest of their death-rate cohort.
(Click on images to enlarge)
Later Peak States
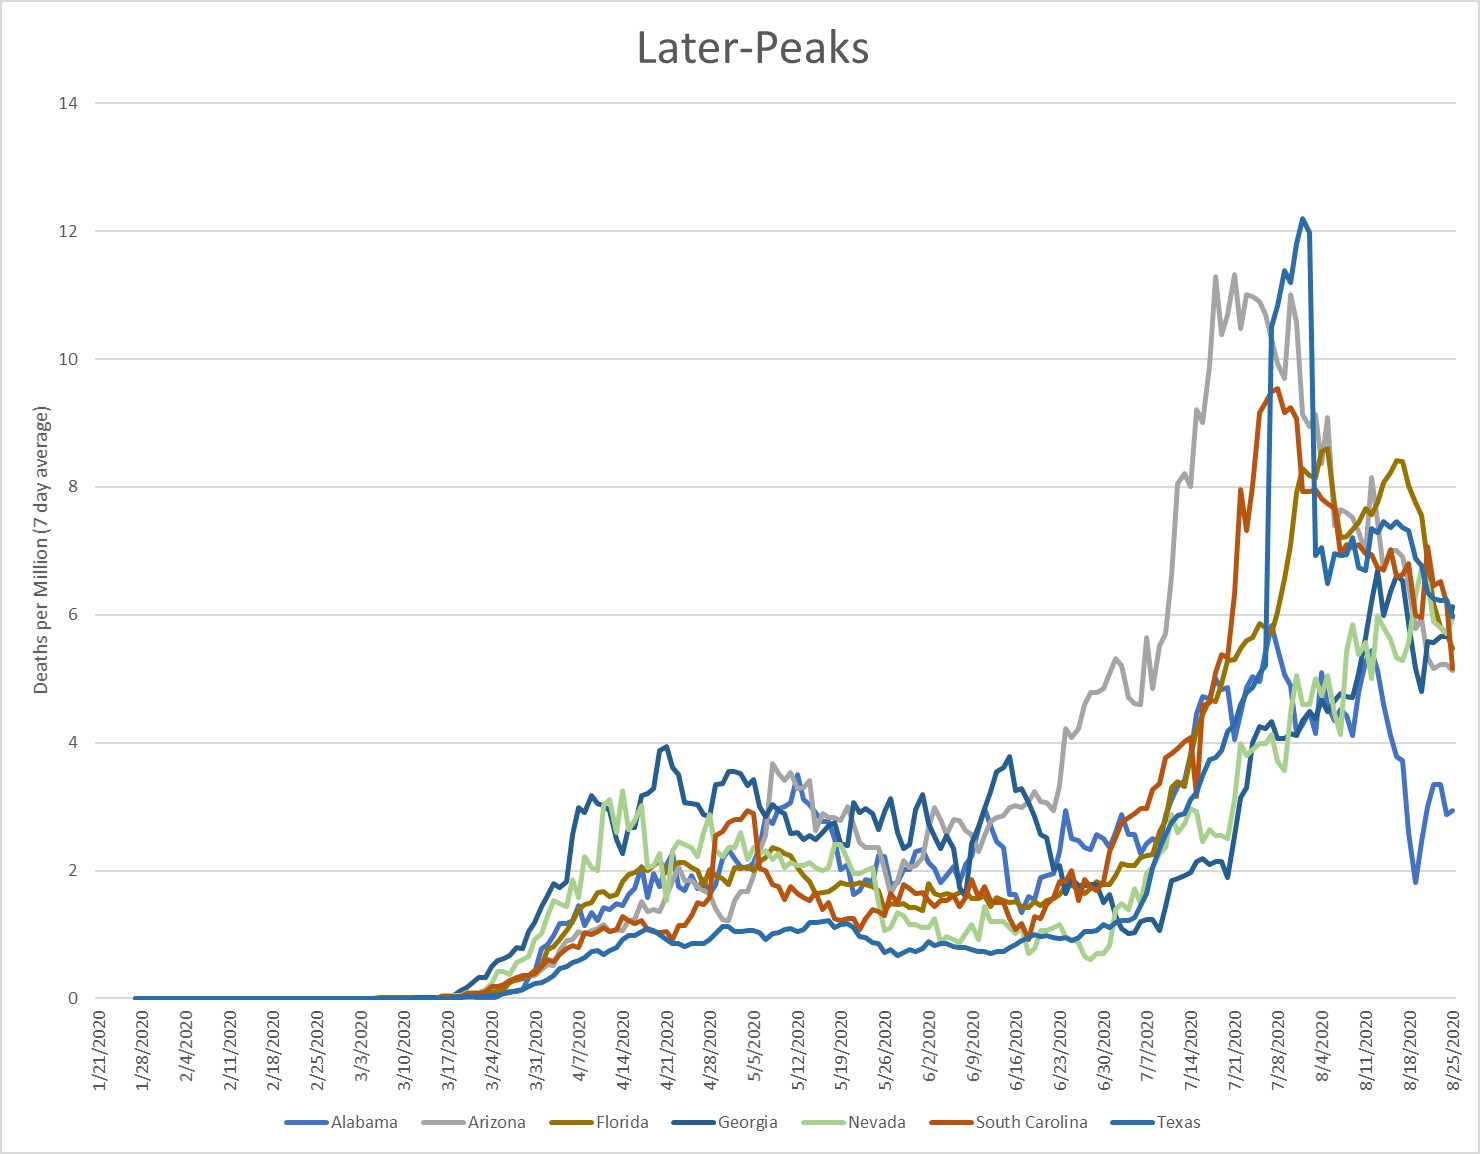
Second are those states that appear to be peaking now. Nevada still appear to be on the way up and Georgia may be. Nonetheless, these late peakers seem to reach 8-12 deaths per million/day and then make their way down. We are still only in the early stages of the downhill and so the trends aren’t as clear. These peaks are lower than the first set. This probably due to a combination of factors including better care, a less dangerous virus, lower infection doses and better protection of the elderly.
Non-Peakers
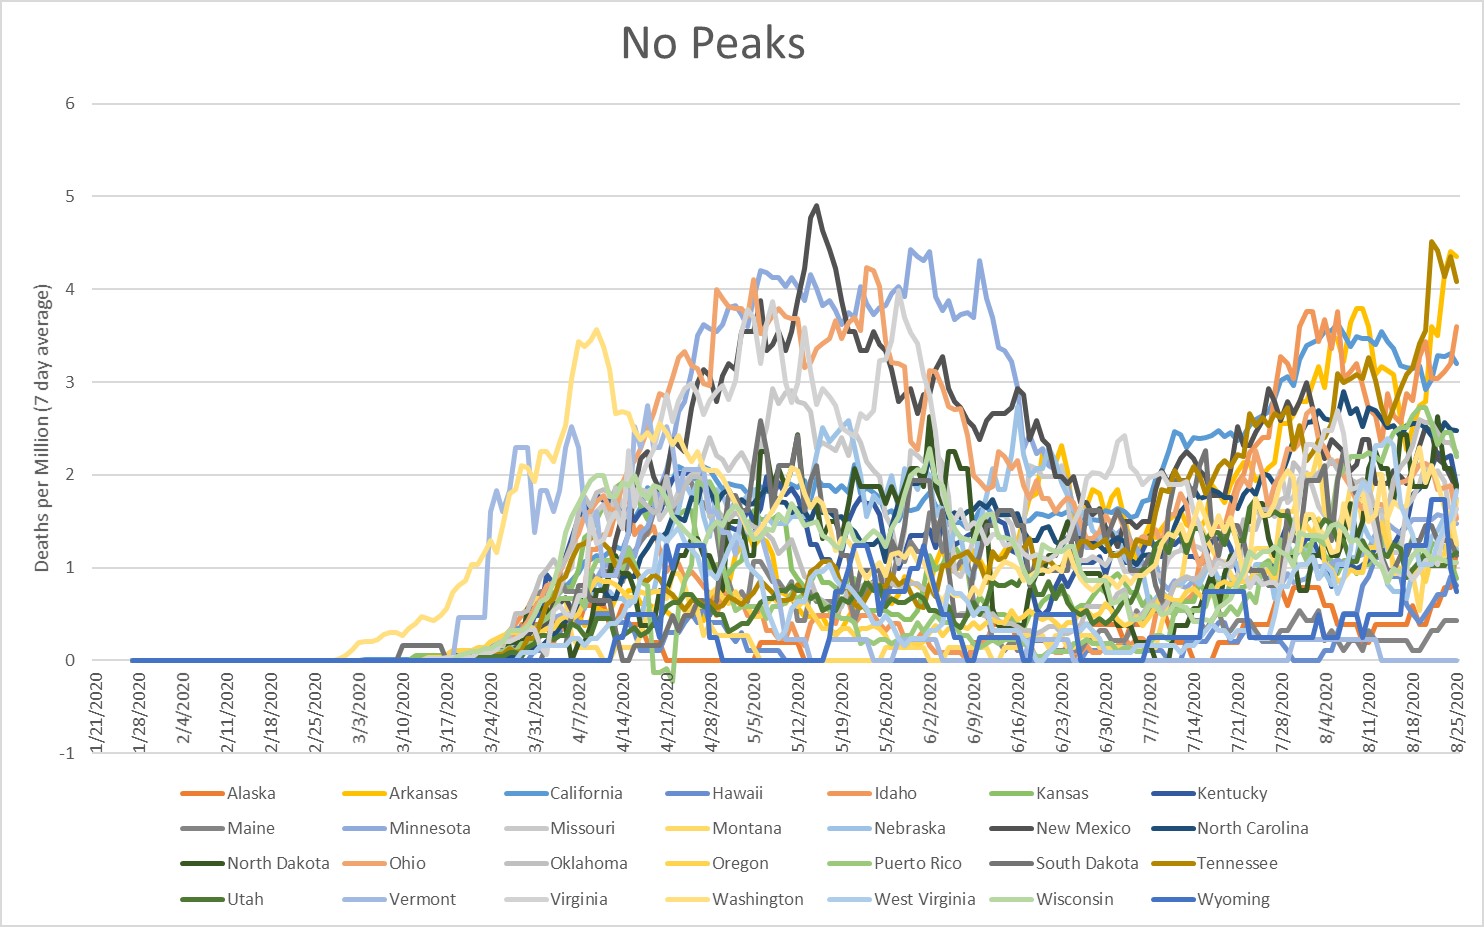
Finally, there are the states that have yet to peak. They all had early bumps, but none above 5 deaths/million. I expect all of these states (unless there is a vaccine) to rise to a future peak. If they don’t then they will continually and slowly rise without ever getting the benefit of community immunity. If they do peak, I expect it will be somewhat lower than the 8-12 range for the states currently peaking. I predict it will be in the 8-10 deaths/million.
Cumulative Deaths
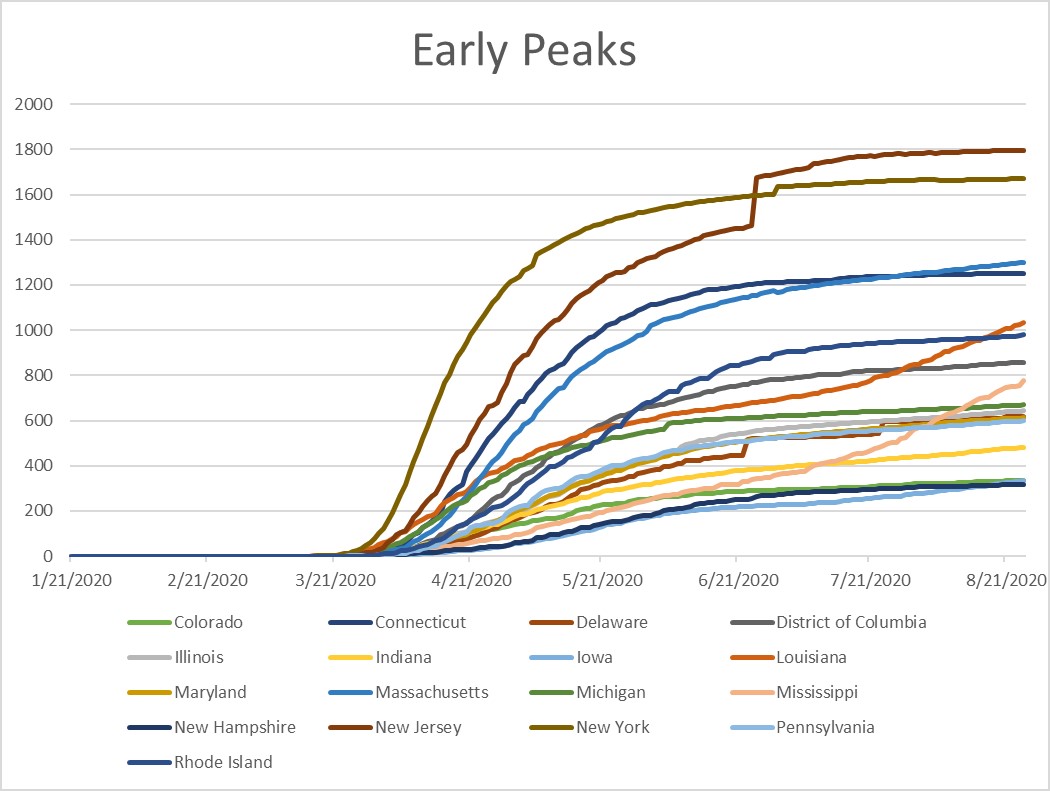
Another way to look at this is cumulative deaths. A short, sharp, rise leads to a leveling off. If this doesn’t happen, the leveling off doesn’t appear to occur.
Eyeballing these charts (no science behind this), I’d expect the Late Peakers to end up in the 5-700 range and the non-peakers that go through a run-up in the virus to end up in that same 3-500 range. Those that don’t could well be higher due to continual re-exposure.
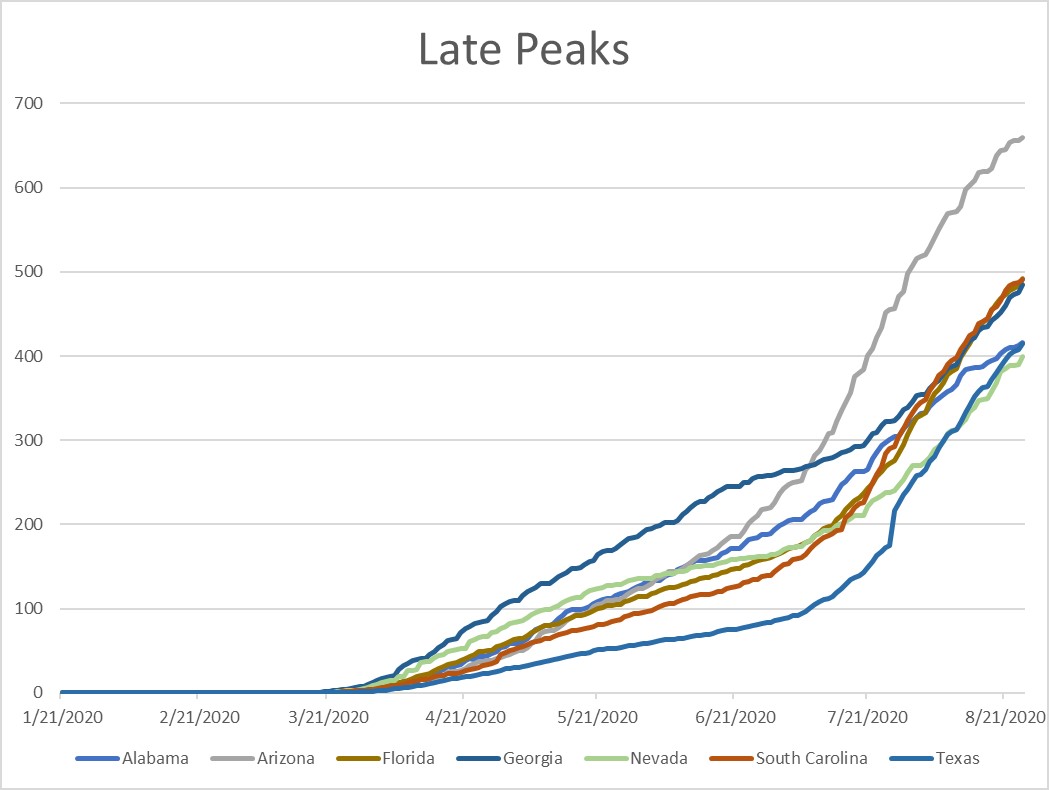
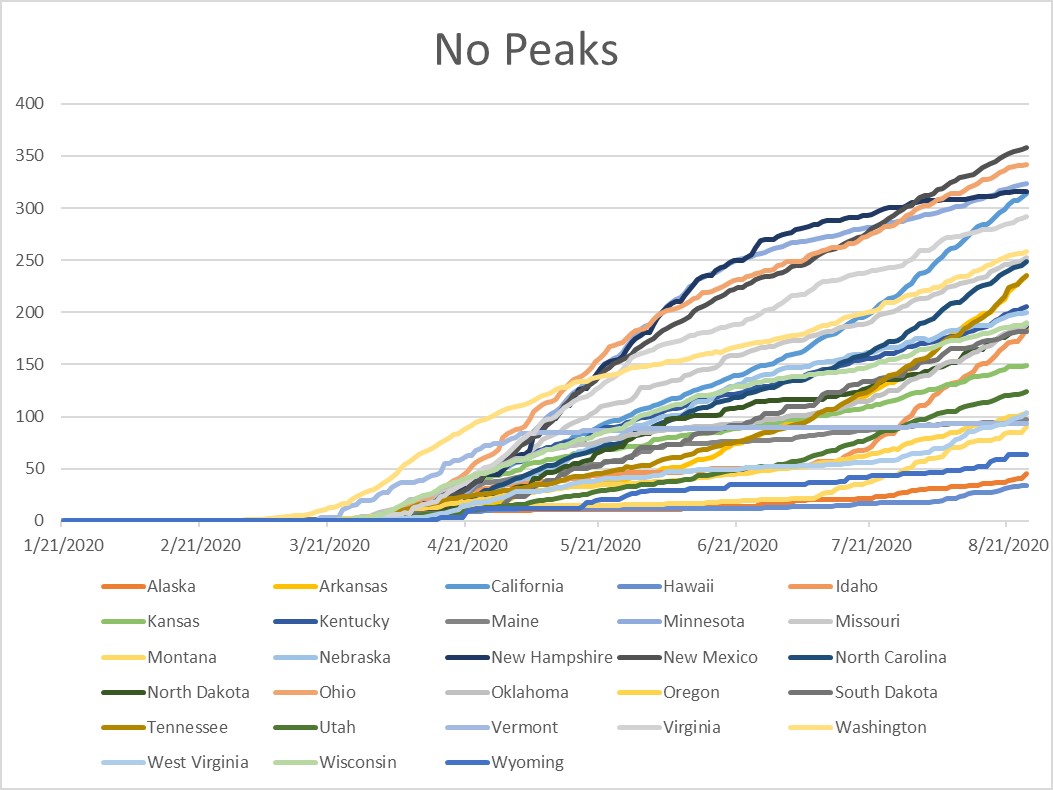
I thus expect the US to have a triple hump with California being the first of that third batch of states.
As I stated at the beginning, I’m not a big believer in macro models so my confidence in the overall picture is low. After all, a vaccine, monoclonal antibodies, dexomathazone or any other number of factors could bring the virus to a halt. It could also get worse, should it mutate into a more dangerous form. I consider this unlikely as a virus spreads more readily if it doesn’t drive its host to isolation or death.



Comments
Log in or sign up to join the conversation.