
With the Biden administration already setting the narrative yesterday that today's inflation print could be 'high', and expectations for a headline print of +7.9% YoY (from +7.5% YoY in January), the bar was high for any surprises and the headline print came in right in the dot at +7.9% YoY - the highest since Jan 1982.
(Click on image to enlarge)
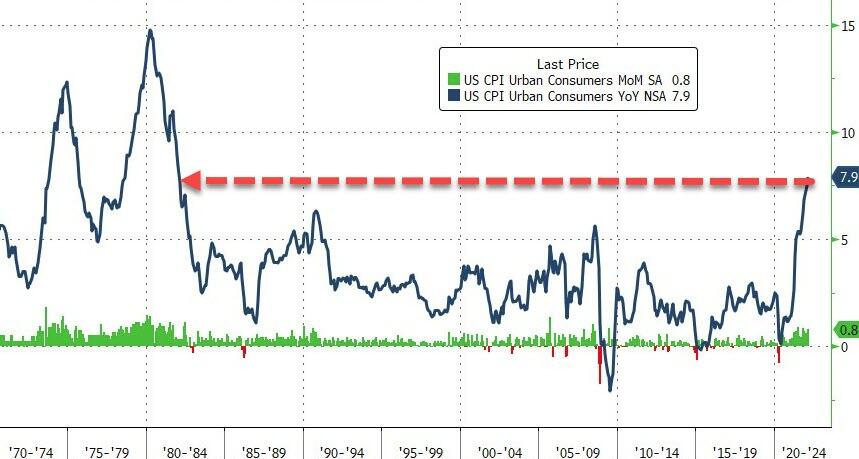
That is the 21st straight month of MoM (non-transitory) increases in consumer prices, with Energy (and Services) dominating the recent surge...
(Click on image to enlarge)

Source: Bloomberg
On a MoM basis, Energy and Services costs also dominated the increases...
(Click on image to enlarge)
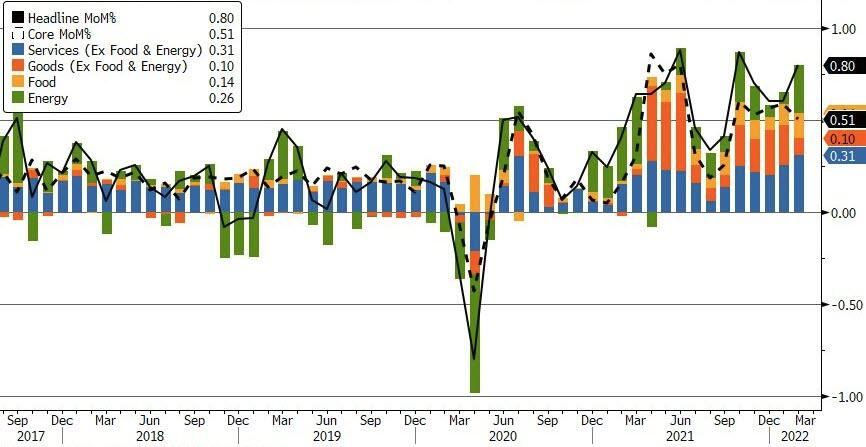
Source: Bloomberg
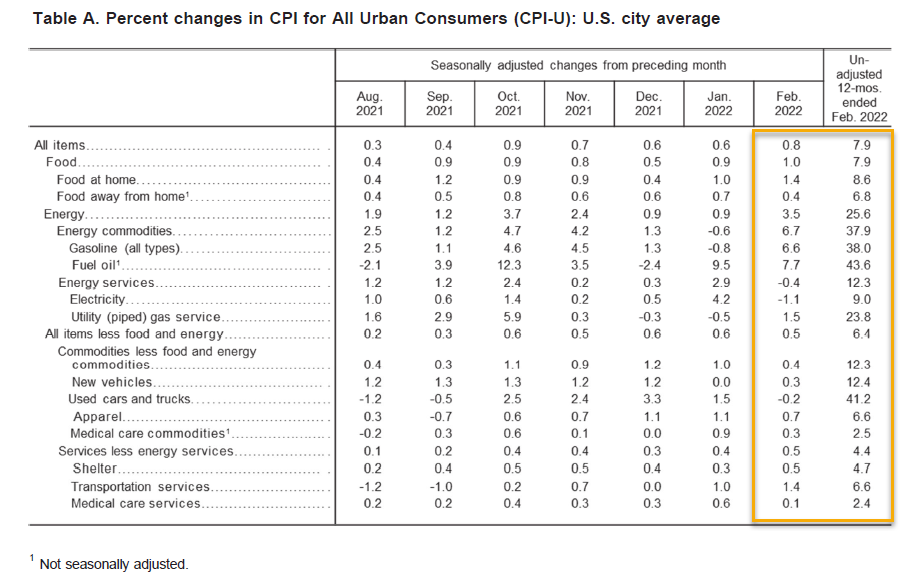
One thing of note... one tiny sliver of hope... Used Car prices fell very modestly in February...
(Click on image to enlarge)
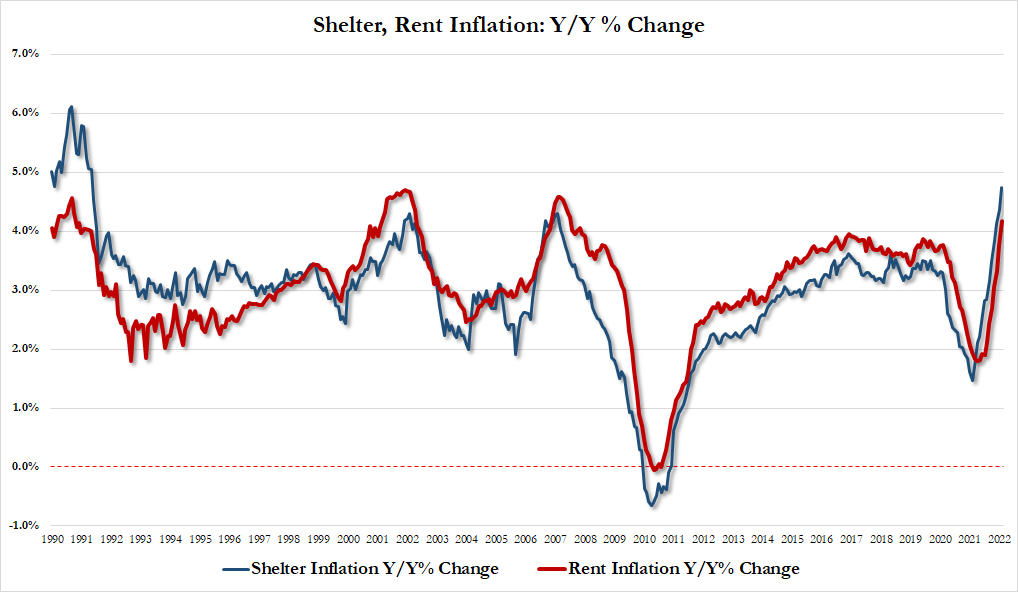
But, in the interest of balance, the costs of a roof over your head are exploding higher...
-
March shelter inflation 4.74%, up from 4.36% in Jan and the highest since May 1991
-
March rent inflation 4.17%, up from 3.76% and the highest since July 2007
(Click on image to enlarge)
Source: Bloomberg
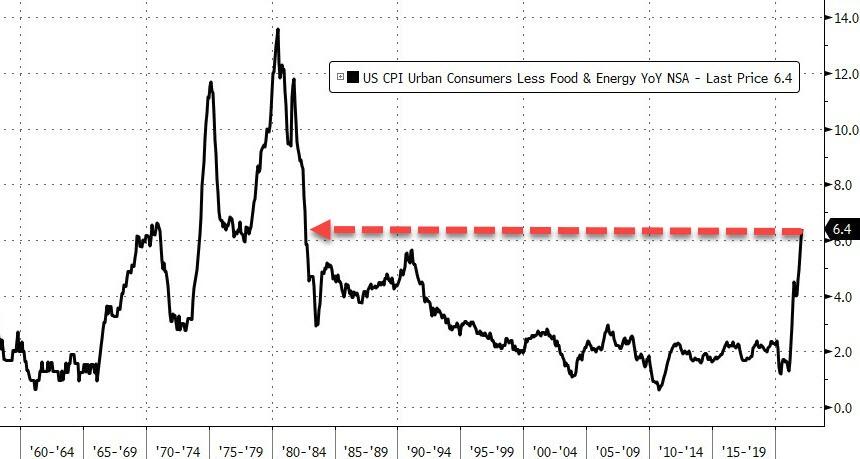
Core CPI rose 6.4% YoY in February (in line with +6.4% expectations and well above +6.0% in January)
(Click on image to enlarge)
Source: Bloomberg
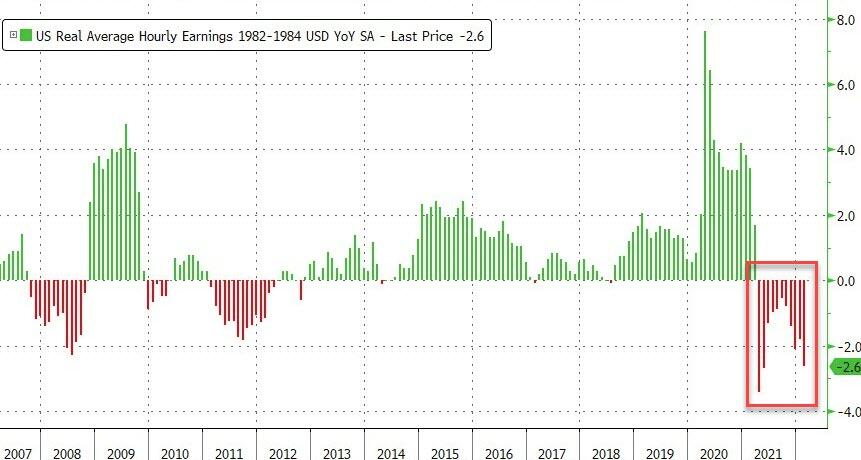
Finally, and to many, most importantly, real wages (average hourly earnings) dropped on a YoY basis for the 11th straight month...
(Click on image to enlarge)
Source: Bloomberg
So the next time the Biden admin tries to tell you to be grateful that your wages are rising, show them that chart!


Comments
Log in or sign up to join the conversation.