

March 2020 is set to go down in the history books. Global stock markets crashed in what is now the fastest drop ever recorded. The Dow Jones 30 stock market index sank more than 8,000 points, or a whopping 32% in just 18 days. Central banks sprung into action slashing rates and pumping money into the economy.
Nothing worked until US leaders approved a $2 trillion stimulus plan sending the Dow Jones 30 index soaring nearly 3,000 points higher in just two days. Will the stimulus plan save the stock market and what is the trade? Let's find out…

The $2 trillion financial lifeline… or is it?
On 25th March Senate leaders and the White House reached an agreement on a $2 trillion economic stimulus package in retaliation to the threat of a near-term recession from the coronavirus outbreak.
In the deal, unemployment benefits would be expanded, more funds would make their way to hospitals and healthcare workers, emergency loans would be issued to small and large businesses and cheques would be sent to Americans - with a $1,200 payment for adults and $500 for each child.
Also included in the deal is a $50 billion lifeline allocated for loans to airlines which has been hit particularly hard by the pandemic and the sudden seizure of worldwide travel. While the US Federal Reserve already issued a monetary lifeline by cutting interest rates, opening up new credit facilities and buying up corporate bonds, investors have been itching for a more fiscal response.
Investors seemingly liked the news with the Dow Jones 30 stock market index soaring more than 11% in a day to record its best day in 87 years. However, any further upside was muted by rumours that Senator Bernie Sanders of Vermont may hold up the bill to address what he called a "$500 billion corporate welfare fund."
Former Federal Reserve Chairman Ben Bernanke appeased investors by saying the economy would experience a very quick rebound after a very sharp recession, which some predicted the world is already in.
Identifying trading opportunities in the chaos…
The effect of the combined action from the US government and the US Federal Reserve has meant volatility has increased significantly in all markets such as currencies, stocks and commodities.
To navigate these markets during these times it is important to have the right trading tools at your disposal. For example, instruments like the Dow Jones 30 Index (DJI30) CFD, or Contracts for Difference, allows traders to trade both long and short, thereby potentially profiting from rising and falling markets.
Below is a long-term, monthly price chart of the DJI30 CFD:
(Click on image to enlarge)
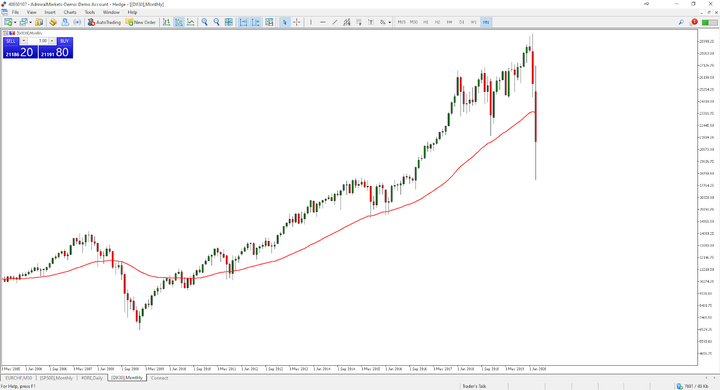
Source: Admiral Markets MetaTrader 5, DJI30, Monthly - Data range: from 1 May 2005 to 25 March 2020, accessed on 25 March 2020 at 9:58 pm GMT. Please note: Past performance is not a reliable indicator of future results.
It's clear to see the uptrend periods and the sell-offs or downtrends. As markets tend to move down a lot faster than they move up, the monthly timeframe may not be the best timeframe to view in such volatile conditions.
Below is a four-hour price chart of the DJI30 CFD:
(Click on image to enlarge)
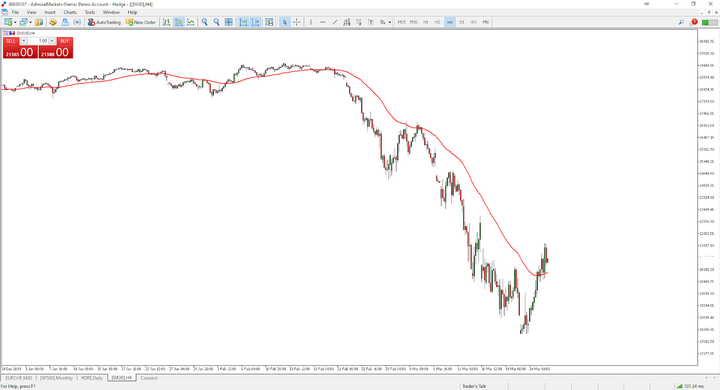
Source: Admiral Markets MetaTrader 5, DJI30, H4 - Data range: from 30 December 2019 to 25 March 2020, accessed on 25 March 2020 at 10:15 pm GMT. Please note: Past performance is not a reliable indicator of future results.
In the price chart above it's clearer to see the downtrend cycles which show that sellers are in control. However, on the announcement of the US's $2 trillion stimulus plan, the price of the Dow Jones 30 Index surged higher. Interestingly, we are now trading above the 50-period exponential moving average (red wavy line) which has historically kept sellers in control as price stayed below it.
Traders may also use technical trading indicators such as the MACD Oscillator which helps to identify reversals in trends through divergences. The chart below shows the price of the DJI30 CFD and the MACD Oscillator at the bottom:
(Click on image to enlarge)
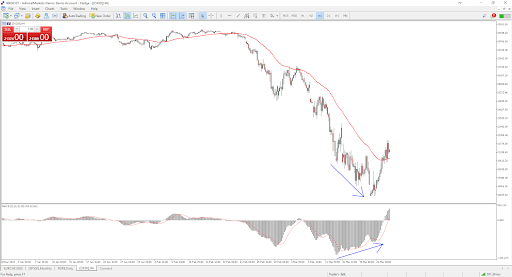
Source: Admiral Markets MetaTrader 5, DJI30, H4 - Data range: from 30 December 2019 to 25 March 2020, accessed on 25 March 2020 at 10:30 pm GMT. Please note: Past performance is not a reliable indicator of future results.
While prices have been declining the MACD Oscillator has been rising. This divergence between price and the indicator is taken as a bullish sign, indicating the potential for some further upside. The MACD Histogram is also now trading above the zero line which is another indication of potential bullishness. However, if the MACD Histogram does cross back below the zero line, it may attract more sellers back to the market.



Comments
Log in or sign up to join the conversation.