

These are stocks I’ll be monitoring over the next week to form valid patterns and potentially trigger a trade. I am currently scanning for and trading continuation contraction patterns (read that article to understand what has to occur in order for a watchlist item to become a trade).
Before getting to the potential swing trades for this week, let’s look at the overall health of the market.
Stock Market Health Check for Swing Trading
Currently, the stock market is healthy and rising (not a forecast). The Nasdaq 100 was lagging for a bit, but it is once again running higher as well.
I am continuing to take valid long trades I see them, and focusing on the contraction continuation pattern.
(Click on image to enlarge)
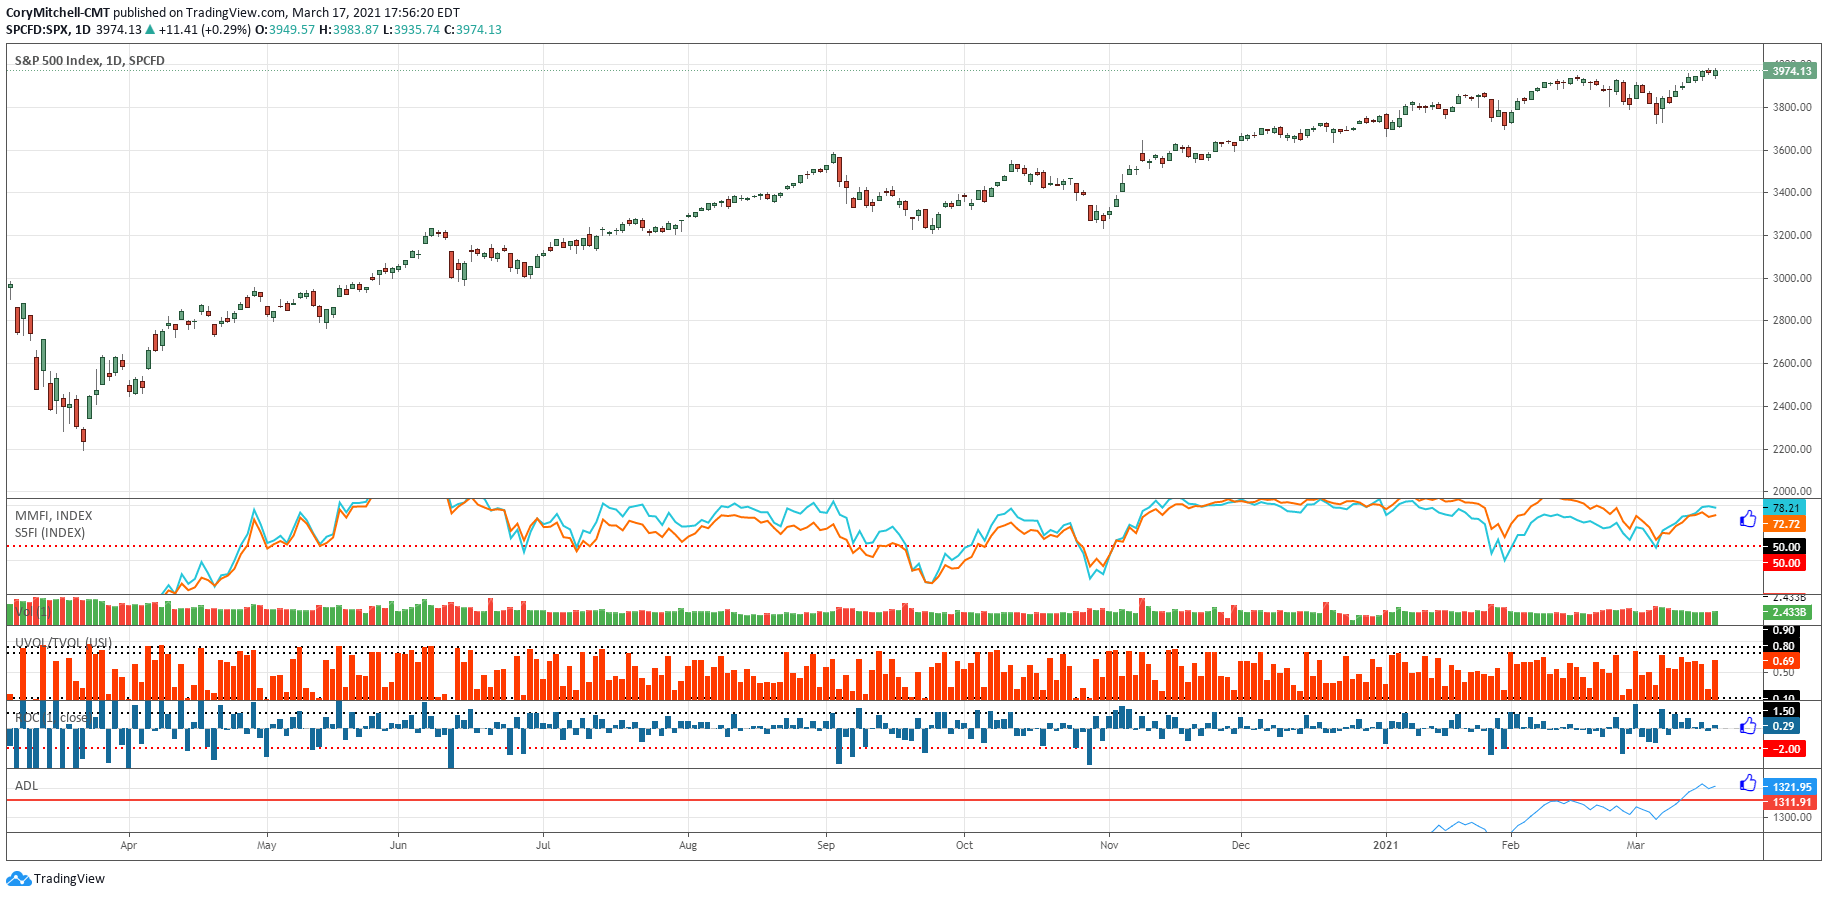
Here are the market health indicator statistics…
- 78% of S&P 500 stocks are above their 50-day moving average (top indicator, blue line). More than 72% of all US stocks are above their 50-day moving average (orange line on top indicator). This means lots of uptrends and easier trading conditions for long positions.
- The blue bars show the daily rate of change in % (second from bottom). Large single-day drops are often (not always) associated with overall declines in the index. This indicator has turned quiet again, which is typical of rising markets.
- The NYSE Advance-Decline Line (bottom indicator) is near highs while the S&P is also near highs. This helps confirm the rally.
Additionally:
- The Nasdaq has sold off more than the other indexes. It is now rallying back strongly, but I am still monitoring that situation. If we see weakness in that index again, it could signal an overall market health issue.
- From a price-action perspective, we are in an uptrend over the longer-term in the S&P 500.
US Swing Trading Watchlist
428 stocks on the scan list. About 60% more than last week. I only went through the top 250 (1 year returns) + plus some from last week.
Raw list. I won’t be trading all of these. Filter for yourself based on reward:risk and quality of the setup.

Contracting and Closer to Setup
GBOX
SID
BW – Coming out of a long-term downtrend.
MARA
SGRY – Needs a tighter consolidation. Odd pattern right now. Giving more time.
QMCO – Brokeout, still near breakout area.
CVGI – Odd more-boxy pattern. Consolidating at the top.
ACRS – Boxy pattern.
Still Needs to Move Up and Consolidate
FCX
OSS
Canadian Swing Trading Watchlist

193 stocks on the scan list. More than double last week. The scan is the same as the one on the right, except I dropped Last Close to > 0.2 to see some additional lower-priced stocks.
Raw list. I won’t be trading all of these. Filter for yourself based on reward:risk and quality of the setup.
Contracting and Closer to Setup
NAN.V
TSD.V
CUR.V
PKT.V – Odd pattern, very brief and small pullback.
VIBE.CN
ISO.V
AYR.A.CN
AXE.V
BBM.CN – Coming out of a long-term downtrend.
Still Needs to Move Up and Consolidate
CNC.V
NNO.V
HS.CN
ARS.V
GIII.V
PCLO.V
JET.V – I like the current tight contraction, which may provide an entry point, but to form a proper contraction setup, it needs to move up and then consolidate again.
POU.TO – A little boxy (not triangular), but given strength, if it consolidates I would consider it.



Comments
Log in or sign up to join the conversation.