
Let's Blame IT
United Continental Holdings, Inc. (UAL) is in the Airlines industry. It is the holding company for United Airlines and Continental Airlines. The Company operates its businesses through two reporting segments: Mainline and Regional Affiliates. The Company manages its business as an integrated network with assets deployed across its Mainline and regional carrier networks. Together with United Express, Continental Express and Continental Connection, these airlines operate throughout the Americas, Europe, Asia and Africa from their hubs in Chicago, Cleveland, Denver, Guam, Houston, Los Angeles, New York, San Francisco, Tokyo and Washington, D.C. United Continental Holdings, Inc., formerly known as United Airlines Corp., is headquartered in Chicago.
We have seen a number of computer glitches and issues today which are leading to a sense of uncertainty for investors and professionals in the world of finance. Chinese markets are in turmoil as many companies have suspended trading and the government has decreed that major shareholders may not dump shares for six months. That carnage was amplified by a suspension of trading on the floor of the NYSE--but not on electronic systems--this morning, AND an outage at the Wall Street Journal desktop computer version of their website. In addition, fliers using United Continental Holdings carriers today received a nasty shock when they tried to take off. Many flights were delayed, grounded, or cancelled outright until issues were fixed and a ground hold was lifted at about 9:45am.
Suspicions were immediately raised that this was some sort of coordinated cyber-attack. However, as of this writing it appears these problems are NOT related. The WSJ is reporting that United was “recovering from a network connectivity issue this morning and restoring regular flight operations.” the NYSE was "experiencing a technical issue," and no explanation has yet been provided for the desktop website outage at the WSJ.
United will take a hit due to the missed flights and will have to issue some vouchers as compensation for travellers. But still, things could have been worse. According to the WSJ, "By midday, United’s temporary grounding had disrupted nearly 30% of its scheduled flights for Wednesday, including 76 cancellations and 1,400 delayed flights, according to masFlight, an aviation-data firm. The average delay was 52 minutes, masFlight said. O’Hare International Airport in Chicago, a United hub, had the biggest disruption, with 183 delays and 11 cancellations."
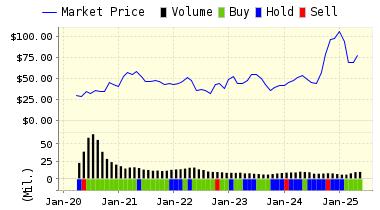
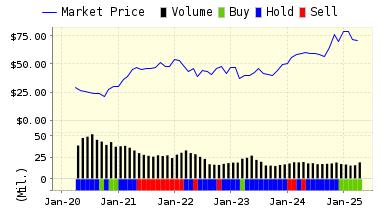
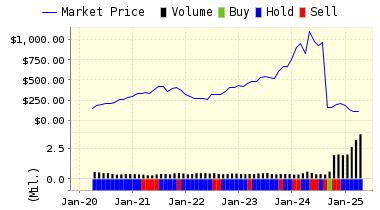
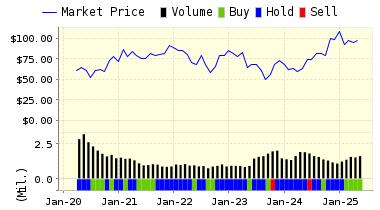
UAL shares have been down recently. However, our models still like UAL and airlines in general. Forecasts remain strong, earnings are high, and other factors look good for profits. But, "the market is always right" and this may be a case where systems have not caught up with reduced earnings--or reduced growth of earnings--which are turning off investors. Also of note, the company has had a bunch of IT issues since its merger with Continental in 2012.
Below is today's more extensive data on UAL:
VALUENGINE RECOMMENDATION: ValuEngine continues its STRONG BUY recommendation on UNITED CONT HLD for 2015-07-07. Based on the information we have gathered and our resulting research, we feel that UNITED CONT HLD has the probability to OUTPERFORM average market performance for the next year. The company exhibits ATTRACTIVE P/E Ratio and Company Size.
|
ValuEngine Forecast |
||
|
Target |
Expected |
|
|---|---|---|
|
1-Month |
54.99 | 1.25% |
|
3-Month |
56.25 | 3.57% |
|
6-Month |
58.67 | 8.02% |
|
1-Year |
62.45 | 15.00% |
|
2-Year |
64.88 | 19.46% |
|
3-Year |
49.07 | -9.64% |
|
Valuation & Rankings |
|||
|
Valuation |
16.33% overvalued |
Valuation Rank(?) |
|
|
1-M Forecast Return |
1.25% |
1-M Forecast Return Rank |
|
|
12-M Return |
22.40% |
Momentum Rank(?) |
|
|
Sharpe Ratio |
0.53 |
Sharpe Ratio Rank(?) |
|
|
5-Y Avg Annual Return |
18.94% |
5-Y Avg Annual Rtn Rank |
|
|
Volatility |
35.63% |
Volatility Rank(?) |
|
|
Expected EPS Growth |
-13.94% |
EPS Growth Rank(?) |
|
|
Market Cap (billions) |
20.04 |
Size Rank |
|
|
Trailing P/E Ratio |
6.21 |
Trailing P/E Rank(?) |
|
|
Forward P/E Ratio |
7.21 |
Forward P/E Ratio Rank |
|
|
PEG Ratio |
n/a |
PEG Ratio Rank |
|
|
Price/Sales |
0.52 |
Price/Sales Rank(?) |
|
|
Market/Book |
6.66 |
Market/Book Rank(?) |
|
|
Beta |
0.41 |
Beta Rank |
|
|
Alpha |
0.23 |
Alpha Rank |
VALUATION WATCH: Overvalued stocks now make up 55.78% of our stocks assigned a valuation and 19.95% of those equities are calculated to be overvalued by 20% or more. Eleven sectors are calculated to be overvalued--five by double digits.
Comments
Log in or sign up to join the conversation.