


The US Dollar (USD) extends its decline against its major peers on Friday as United States (US) Treasury Yields correct after failing to extend the rally.
US Dollar Price Today
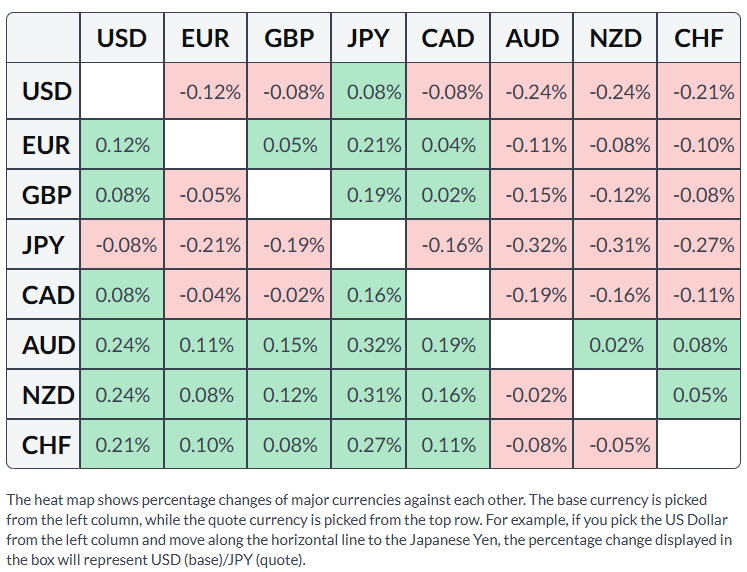
The table below shows the percentage change of US Dollar (USD) against listed major currencies today. US Dollar was the weakest against the Australian Dollar.
In the Asian trade, the US Dollar Index (DXY), which gauges the Greenback’s value against six major currencies, trades 0.1% lower to near 102.02. The DXY faced significant selling pressure on late Thursday after failing to extend the rally beyond its yearly high of 102.54 posted earlier this year. 10-year US Treasury Yields have retreated to near 5.23% from its Thursday’s high of 5.35%.
Yields on US-backed securities came under pressure as oil prices cut gains after President Donald Trump ruled out fears of renewed military activities against Iran till Mid-term elections.
“We [US] will not be attacking Iran at any time prior to the Midterm Elections to be held in the United States on November 3rd,” US President Trump said through a post on Truth Social, adding, “We are having productive discussions with the Islamic Republic of Iran.”
Going forward, the major trigger for the US Dollar will be the US Consumer Price Index (CPI) data for September, which will be released on Wednesday. The inflation is expected to have a significant impact on Federal Reserve’s (Fed) interest rate expectations.
Currently, the CME FedWatch tool shows that financial markets have priced in at least one interest rate hike in the remainder of the year.
US Dollar Index Technical Analysis
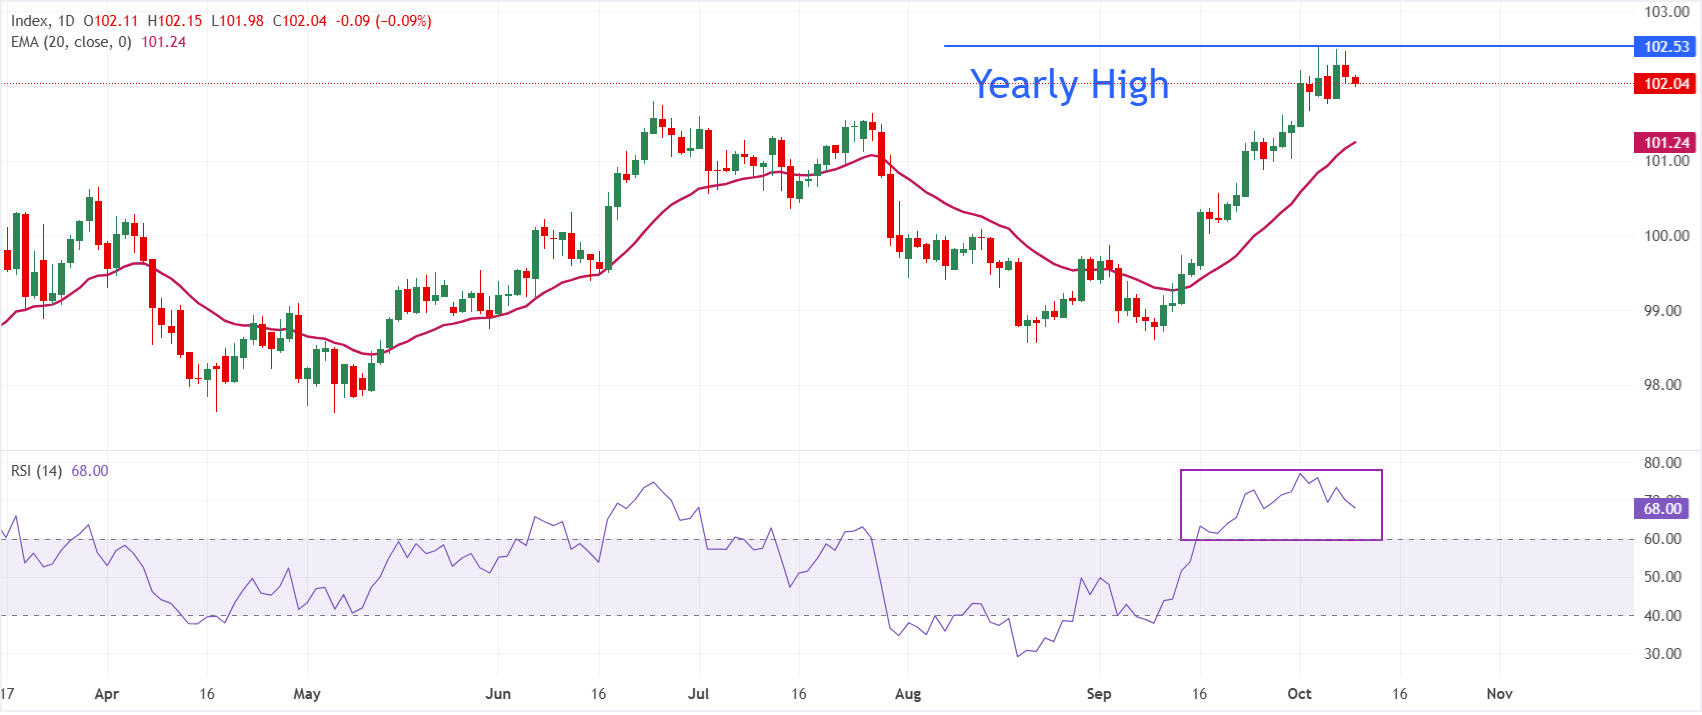
In the daily chart, Dollar Index Spot trades at 102.03, holding above the 20-day exponential moving average (EMA) at 101.24, which suggests a bullish near-term bias with the trend underpinned by dynamic support. The Relative Strength Index (14) at 67.91 hovers just below overbought territory, hinting that upside momentum remains strong but may be entering a more mature phase where further gains could be slower or prone to brief pauses.
On the downside, initial support is located at the 20-day EMA at 101.24, where a decisive break would weaken the bullish structure and open the door to a deeper corrective phase toward prior price congestion zones. Looking up, the yearly high at 102.54 is the major hurdle.



Comments
Log in or sign up to join the conversation.